Indianapolis Racial Equity Report Card
July 2024 Complete our Community Feedback SurveyPDF Version Coming SoonIntroduction
Indianapolis is a racially and ethnically diverse city, with just over half of its residents identifying as white. The other half is comprised of: 28% Black, 11% Hispanic, 4% Asian, and 4% other.
Our populations of color are growing quickly. For example, people identifying as two or more races increased by 191%, or nearly tripled, in the last decade, following national trends. Furthermore, the National Equity Atlas projects that 70 percent of Marion County residents will be non-white by 2050, one of the highest projected percentages for any county in the Midwest.i
|
As our diversity has grown, the disparities between racial and ethnic groups have become more apparent. There has been a considerable amount of work being done in the community to eliminate these racial disparities and make Indianapolis more equitable. This was the impetus for the Polis Center to produce this Racial Equity Report Card – to provide research and analysis showing how the city is doing on racial equity, help others identify the areas where improvements are most needed, and provide a means for holding the community accountable by measuring change going forward. To build this report card, we first looked to the community to envision an equitable Indianapolis. We chose indicators based on feedback from hundreds of community members, city leaders, and an equity research advisory committee along with review of literature. This project is an evolving report designed to highlight racial disparities and inequities across multiple sectors. Look for additional features in the future.
|

Equality is Different from Equity
Equality refers to the idea of treating everyone the same, regardless of their individual circumstances or needs. The focus of equality is ensuring all individuals have the same access to the same resources and opportunities.
Equity is different from equality. It focuses on leveling the playing field, recognizing that not all individuals start from the same place and may require various levels of support or resources to achieve the same outcome. It involves distributing resources and opportunities based on the specific needs of individuals, with the goal of achieving fairness and addressing barriers that may prevent certain groups from reaching their full potential.
While equality emphasizes sameness and uniform treatment, equity focuses on fairness and providing individuals with what they need to succeed, considering their unique circumstances and challenges.
The Indianapolis Racial Equity Report card measures equality to help users of the tool gain a better understanding of the resources, actions, policies, and strategies necessary to get as close as we can to racial equity.
Why is racial equity important?
As with most diverse communities in America, significant disparities have developed over time in Indianapolis. Historic redlining policies, ‘‘white flight,’’ inequitable resource allocation, and other factors have all contributed to a situation where race is a dividing factor between ‘‘haves’’ and ‘‘have-nots’’ on many measures . Racial and ethnic disparities in Indianapolis mirror national trends, with Black and Hispanic residents earning less, having lower educational attainment, and suffering greater housing and environmental burden than White residents. Indeed, these disparities are historically and geographically "sticky" - what is unequal in Pittsburgh in 2010 is similarly unequal in Milwaukee in 2020. This stickiness contributes to a dangerous and inaccurate assumption that little can be done to affect change at the local level.
Our analysis takes a more optimistic perspective, identifying areas where Indianapolis is doing better than its peers and other areas where there are opportunities to close gaps. The entire community of Indianapolis will benefit from a more equitable city. When everyone is has positive outcomes, this promotes a stronger economy, strengthens communities, and reinforces our country’s values.
The Report Card Explained
The Report Card is guided by a fundamental question: “How is Indianapolis doing?” It aims to answer that question by examining 31 indicators across seven thematic categories (economy, health, education, access, environment, criminal justice, and housing). For each thematic area, the report includes one key indicator of equity, followed by several indicators that are considered drivers of the key indicator.
We created a card for each indicator that includes:
- A chart comparing the data by race/ethnicity for Indianapolis (defined as Marion County). At a quick glance, you can see racial disparities (the race gap).
- A rank for each race/ethnicity that shows how the outcomes for that race or ethnic group in Indianapolis rank among the same group in 50 comparison cities.
- An equity grade that shows how Indianapolis’ race gap ranks among 50 comparison cities. The race gap is defined by comparing the outcome for white residents to the outcomes for minority residents (Black, Hispanic, and Asian). We use the white population as a reference point in this analysis because of the historic social and political dominance of Whiteness in American history.
- Additional data such as trend charts and maps for those who want to explore further.
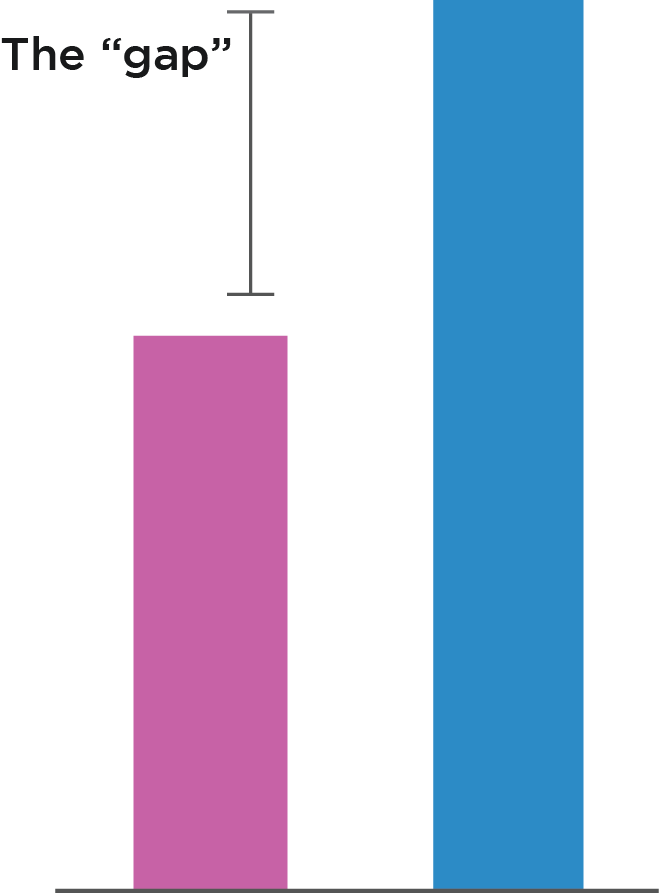 |
What is a disparity?There are often significant gaps between demographic groups for indicators (such as income or education). When we talk about measuring “racial equity”, we are measuring the severity of these gaps. When these “gaps” are compared to each other within Indianapolis and against other cities, it can offer a useful understanding of disparity between racial groups.
|
|
|
|
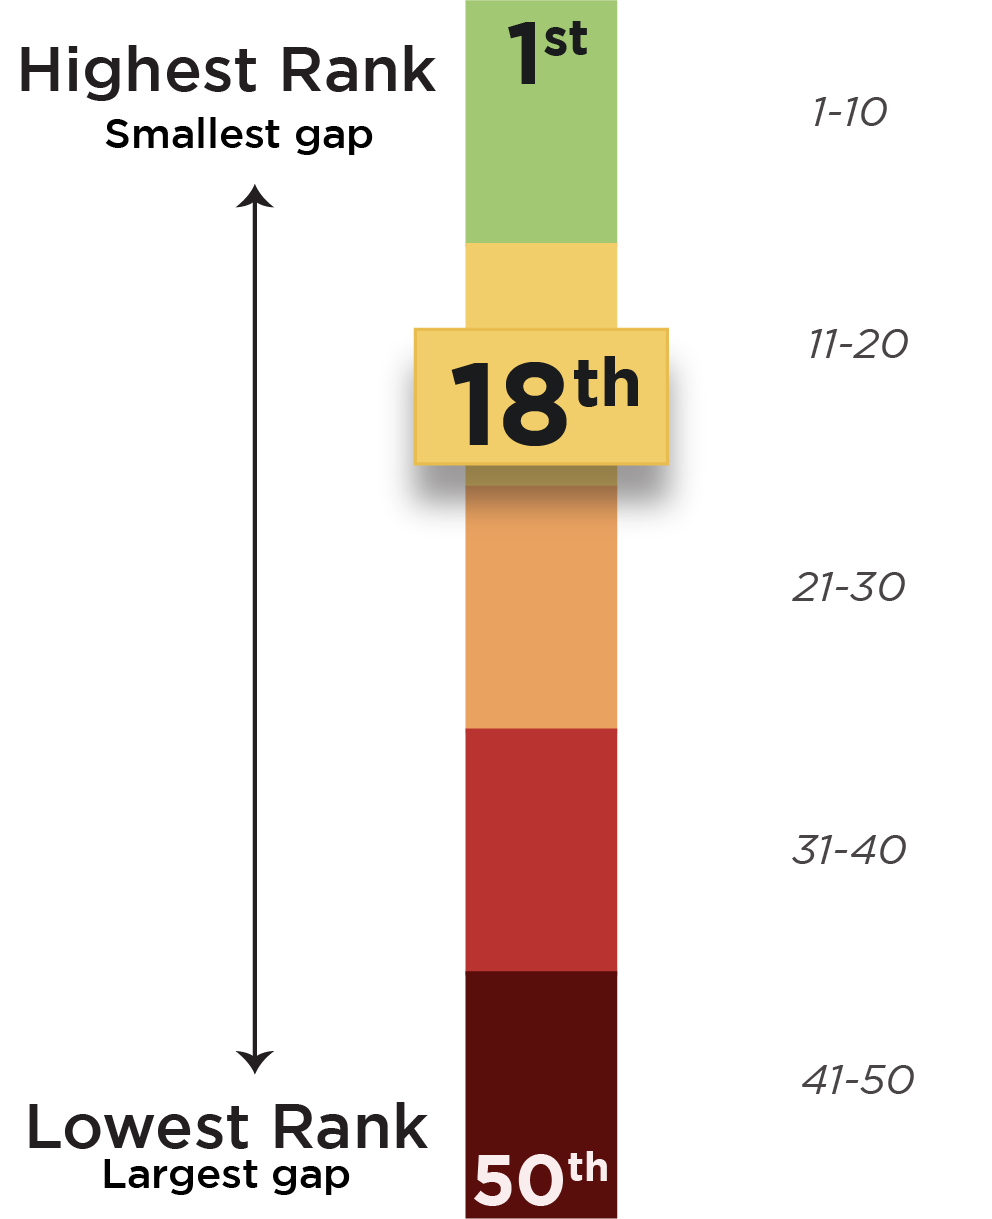 |
What do city rankings mean?For certain indicators, Indianapolis receives a city ranking among 50 comparison cities. If the disparity (or “gap”) between white residents and minority residents is smaller in Indianapolis than other cities, it will rank better (a rank of 1 is the city with the best equity); if there is more racial disparity in Indianapolis than peer cities, its rank will be closer to 50 (a rank of 50 is the city with the worst equity). |
The Indicator Cards
The Rankings Explained
To compare Indianapolis to other cities, we selected forty-nine “peer cities” using multiple factors: population, size, regionality, economy, demographics, and cost of living. Some cities are more similar than others; however, having a larger peer group allows for more robust comparisons by race. See here for a list of cities.
This comparison adds important geographic context as well as offer a range of values against which Indianapolis’ inequity can be interpreted. For example, is the disparity in income between races in Indianapolis greater than other places, about the same, or less? Is there something we can learn from cities that are doing better on equity?
Because each city has a unique demographic makeup, these rankings are just one piece in a larger story of measuring inequity. For example, a Hispanic individual in Nashville may see that their subgroup has a similar rank in a certain indicator as a Hispanic individual in San Jose, but their lived experiences may be very different. And a college town is more likely to rank higher on bachelor’s degree attainment than other cities. What these rankings can provide is a useful starting point to thinking about inequity.
How is Indianapolis Doing?
- Indianapolis is more equitable than other cities based on the outcomes in areas of: reading scores (Indy ranks 9th), environmental burden (10th), diabetes death rate (10th), overdose death rate (10th), suicide rate (8th), eviction filing rate (9th), and jailing rate (8th).
- We have larger disparities than other cities in areas of: broadband access (42nd), smartphone access (40th), unemployment rate (31st), bachelor's degree attainment (36th), associate degree or above (31st), Alzheimer’s death rate (34th), and homicide rate (36th).
- The white population in Indianapolis is generally worse off in many of these areas than white populations in peer cities. Since white often is the race group with a larger advantage for several indicators, this means that Indianapolis’ minority populations are even worse off.
The following chart lists Indianapolis’ equity grade for each indicator and includes an arrow to indicate how the ranking has changed over the past ten years
Share your feedback!
We continue to improve the report card based on feedback. Please fill out this survey to provide input on the indicators we selected, what you think is missing, and general feedback about the report card. Thank you!
How do Indianapolis’ race groups rank amongst their counterparts in other cities for this indicator? The rank for a race group is an indication of how well outcomes are for that race group, regardless of outcomes for other races.
• A rank of 1 means that race group is doing better in Indianapolis than all other cities.
• A rank of 50 means that race group is doing worse in Indianapolis than all other cities.
Example:
Note: Poor outcomes for white residents in Indianapolis are not always correlated with poor outcomes for minority residents when compared to other cities.
This is Indianapolis’ overall equity ranking among 50 comparable cities for this indicator. The ranking is derived by comparing the size of the disparity between the minority and white residents in each city.
• A rank of 1 means a city has the least disparity (or sometimes, no disparity) between minority and white populations.
• A rank of 50 means it has the largest disparity.
For each city, we calculated a gap between each non-white group and the white population using a ratio and then averaged those gaps, weighting them by total population. We then ranked the result for each city 1 to 50.
Note: Poor outcomes for white residents in Indianapolis for an indicator can result in a better equity ranking. Better equity rankings do not always correlate with better rankings for individual race groups.
These cities have consistently improved their Racial Equity Ranking for this indicator over the last 5 years. They have significantly closed the equity gap relative to other cities.
What can Indianapolis learn from this city? Did it implement a new program or policy to spark this positive change?
These cities rank among the least inequitable cities for minority groups on this indicator. They have the smallest disparity (or no disparity) when compared against outcomes for white residents.
What can Indianapolis learn from these cities? What conditions, policies, and programs in these communities have a positive influence on racial equity?
 |
Health
How is Indianapolis Doing in Health?Many systemic factors contribute to health inequity in Indianapolis, including policies, racial bias in healthcare, and "weathering" (the health effects of stress and discrimination). People of color have worse health outcomes and are more likely to be impacted by infectious disease such as COVID-19. Indianapolis community efforts have focused on working with hospitals to reduce unnecessary deaths and improve diversity and inclusion.
|
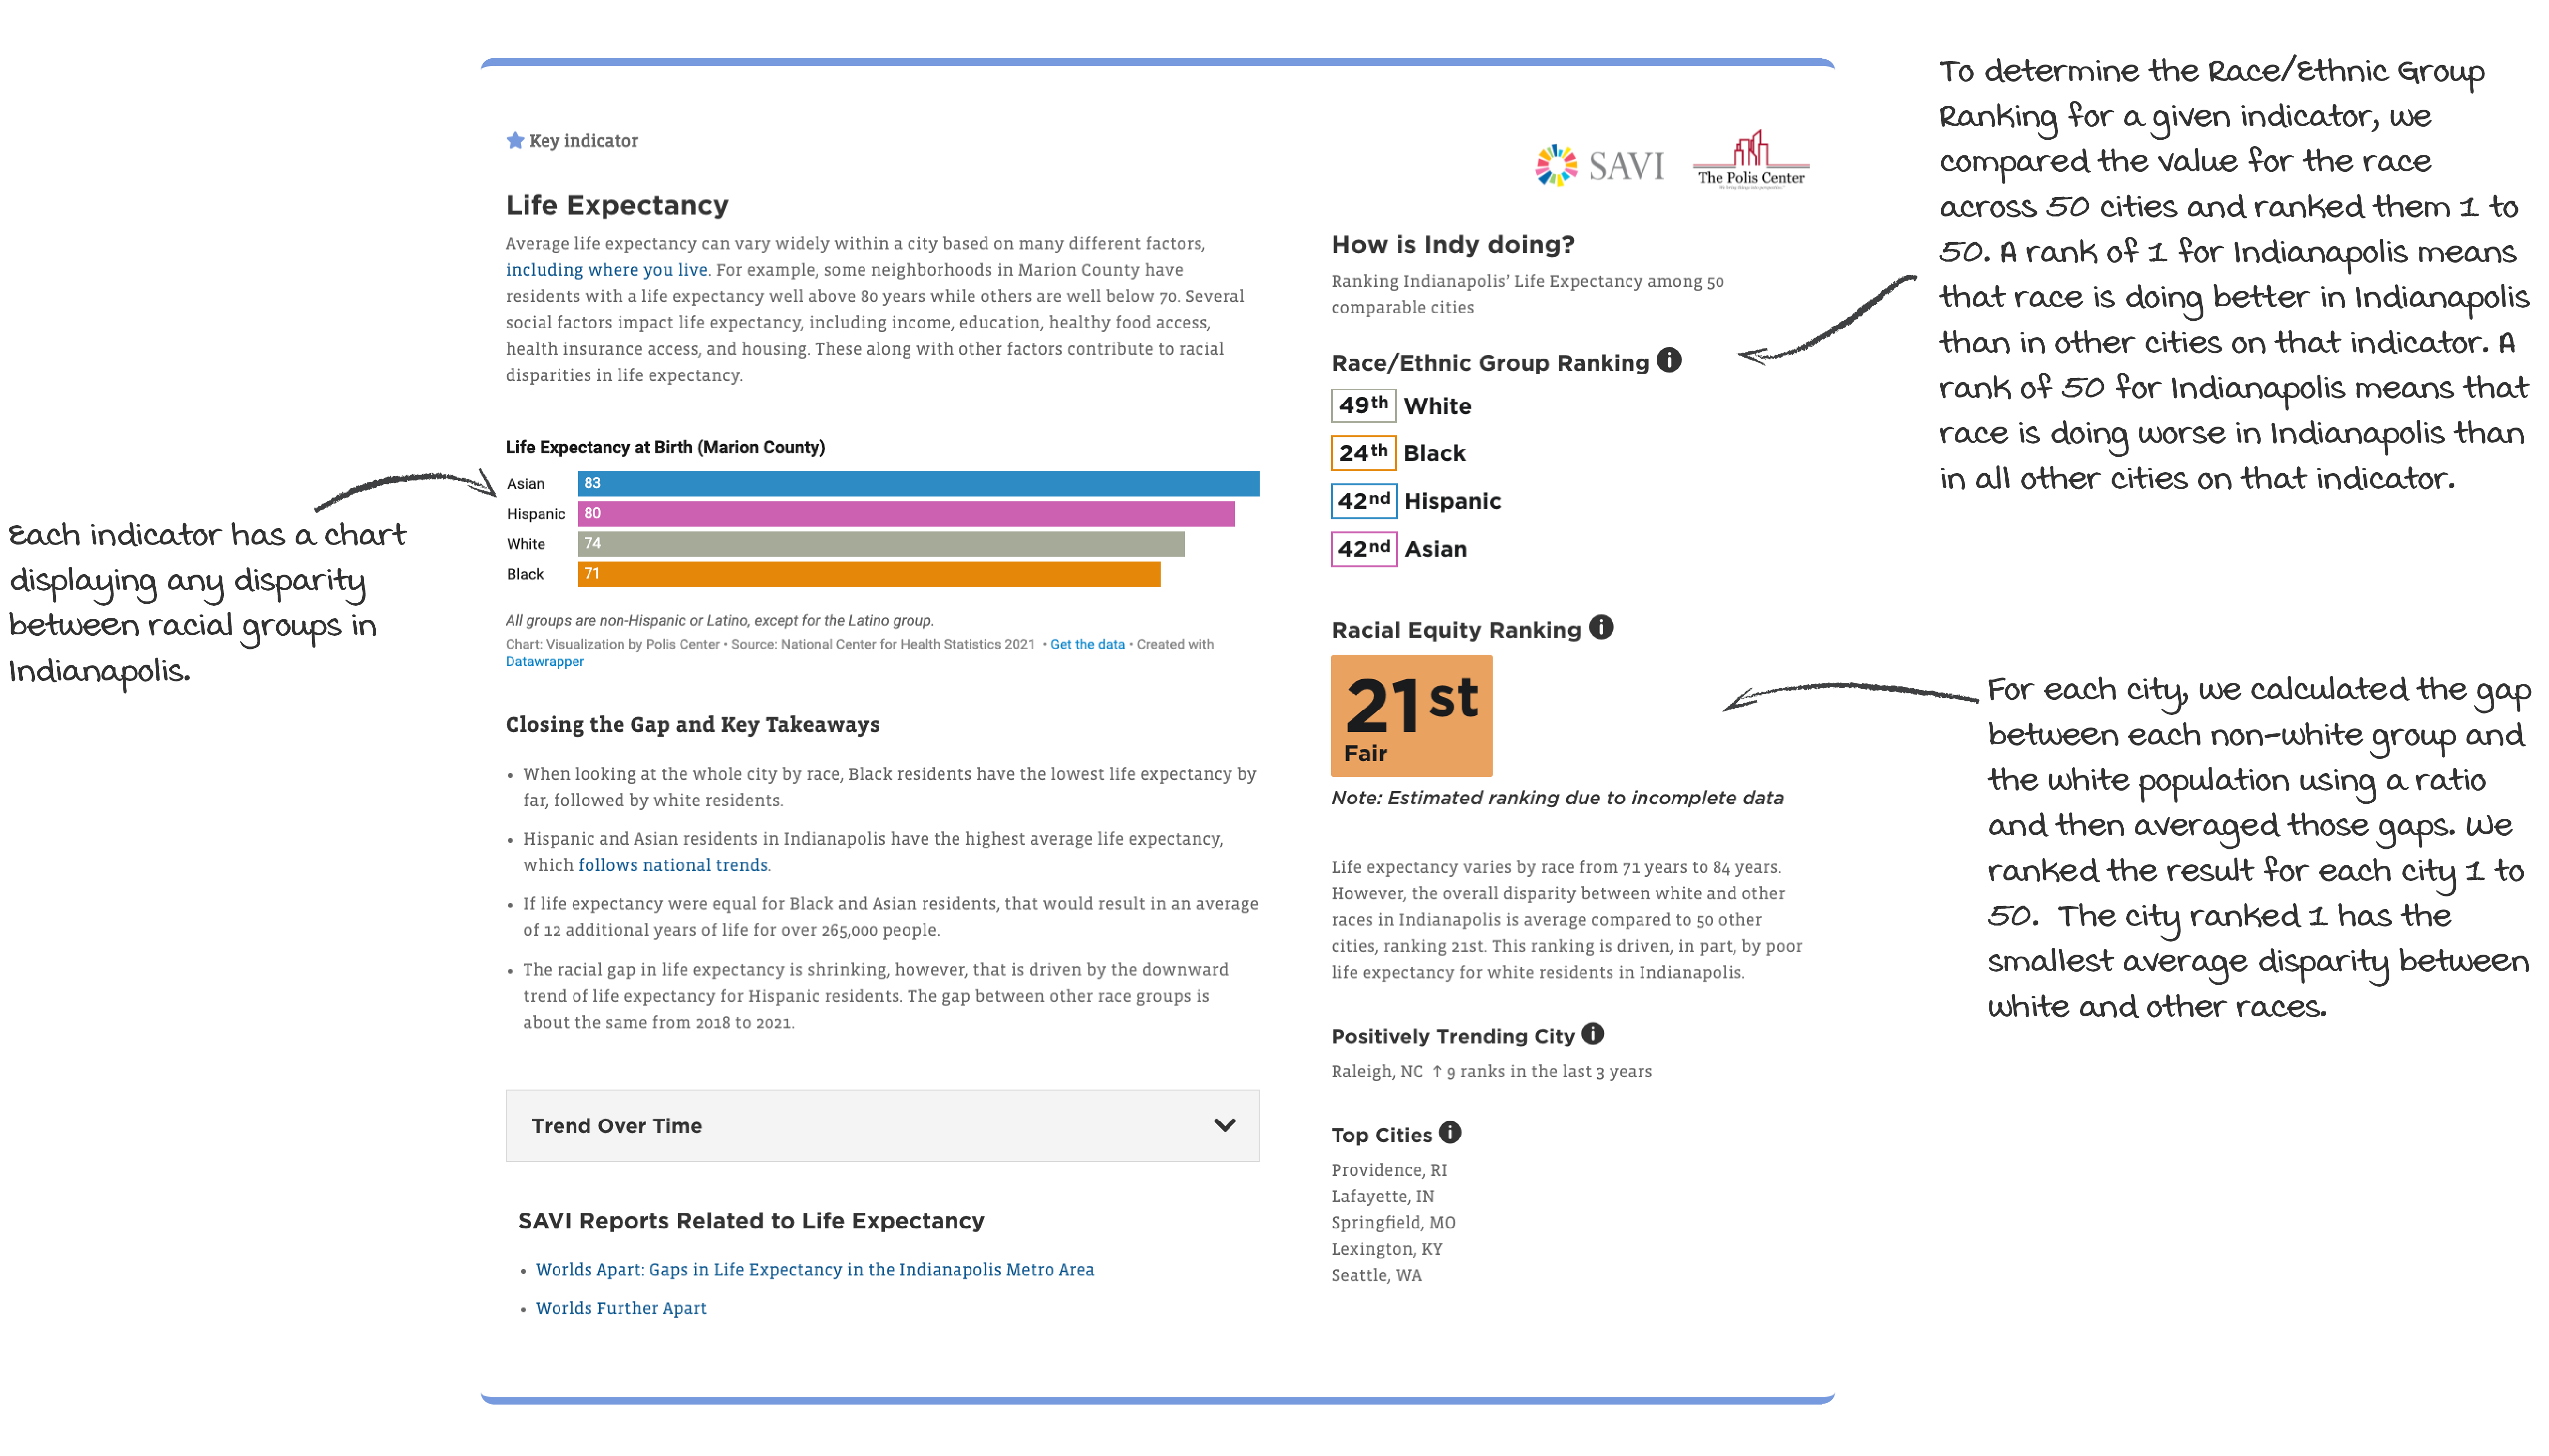
Key indicator
Life Expectancy
Average life expectancy can vary widely within a city based on many different factors, including where you live. For example, some neighborhoods in Marion County have residents with a life expectancy well above 80 years while others are well below 70. Several social factors impact life expectancy, including income, education, healthy food access, health insurance access, and housing. These along with other factors contribute to racial disparities in life expectancy.
Closing the Gap and Key Takeaways
- When looking at the whole city by race, Black residents have the lowest life expectancy by far, followed by white residents.
- Hispanic and Asian residents in Indianapolis have the highest average life expectancy, which follows national trends.
- If life expectancy were equal for Black and Asian residents, that would result in an average of 12 additional years of life for over 265,000 people.
- The racial gap in life expectancy is shrinking, however, that is driven by the downward trend of life expectancy for Hispanic residents. The gap between other race groups is about the same from 2018 to 2021.
Trend Over Time

SAVI Reports Related to Life Expectancy

How is Indy doing?
Ranking Indianapolis’ Life Expectancy among 50 comparable cities
Race/Ethnic Group Ranking
49th White
24th Black
42nd Hispanic
42nd Asian
Racial Equity Ranking
Note: Estimated ranking due to incomplete data
Life expectancy varies by race from 71 years to 84 years. However, the overall disparity between white and other races in Indianapolis is average compared to 50 other cities, ranking 21st. This ranking is driven, in part, by poor life expectancy for white residents in Indianapolis.
Positively Trending City
Raleigh, NC ↑ 9 ranks in the last 3 years
Top Cities
Providence, RI
Lafayette, IN
Springfield, MO
Lexington, KY
Seattle, WA
Driver of Life Expectancy
Lack of Health Insurance Access
Not everyone has access to health insurance or reliable, high-quality healthcare. Federal programs like Medicare and Medicaid provide health insurance to older and lower income residents, however, people without citizenship cannot always access those programs. As a result, Hispanic residents have the highest uninsured rate since many do not meet the eligibility requirements.
Closing the Gap and Key Takeaways
- Hispanic residents are more likely to not have health insurance at 3.5 times the rate of white residents.
- If insurance rates were equal between Hispanic and white residents, that would result in nearly 25,000 more people with insurance coverage.
- Health insurance access is improving for the Hispanic population, which is reducing the overall access gap by race. Other race groups remain about the same.
Trend Over Time
Map
To toggle between different races, click the > button.
SAVI Reports Related to Lack of Health Insurance Access
How is Indy doing?
Ranking Indianapolis’ Lack of Health Insurance Access among 50 comparable cities
Race/Ethnic Group Ranking
43rd White
33rd Black
40th Hispanic
41st Asian
Racial Equity Ranking
Despite the significant disparity for Hispanics in Indianapolis for health insurance access, Indianapolis’ average gap between white and other races is smaller than 35 of its 50 peers, ranking 15th.
Positively Trending City
Evansville, IN ↑ 15 ranks
Top Cities
Flint, MI
Jacksonville, FL
Toledo, OH
Kalamazoo, MI
Springfield, MO
Driver of Life Expectancy
Diabetes
Race, poverty, and geographical location are intertwined factors that contribute to disparities in both the prevalence of diabetes and the mortality rates associated with the disease. According to national CDC data, Black residents are more prone to developing diabetes than their white counterparts but are comparable in the rate of deaths related to diabetes, and this holds true in Indianapolis.
Closing the Gap and Key Takeaways
- The death rates related to diabetes for white and Black residents is three to four times that of Hispanic and Asians.
- If rates were equal across all races, there would be 58 fewer deaths per 100,000 people every year in Indianapolis.
- The death rate for diabetes fluctuated from 2018 to 2022, but the rate for race groups and the gap between them remains about the same.
Trend Over Time
SAVI Reports Related to Diabetes
How is Indy doing?
Ranking Indianapolis’ Diabetes among 50 comparable cities
Race/Ethnic Group Ranking
40th White
16th Black
21st Hispanic
14th Asian
Racial Equity Ranking
Indianapolis ranks in the top ten cities on equity in diabetes deaths, with a smaller-than-average gap between white and other race groups. Even though the rate for Hispanic and Asian residents is considerably lower than for white residents, this is a weighted average, and those race groups have the smallest population. The very large gap in diabetes death rate between the white and these two minority groups contributes less to the rank score than the small gap between white and Black residents.
Positively Trending City
Akron, OH ↑ 26 ranks
Top Cities
Iowa City, IA
Providence, RI
Green Bay, WI
Madison, WI
Springfield, MO
Driver of Life Expectancy
Heart Disease
While heart disease is more prevalent among white Americans, Black Americans face a higher likelihood of mortality from the disease. However, in Indianapolis, white residents are more prone to heart disease-related fatalities than Black residents, and both rates are well above the rate for Asian and Hispanic residents.
Closing the Gap and Key Takeaways
- Despite Hispanic residents having the highest number of uninsured residents, they have the lowest number of deaths related to heart disease.
- The death rate for white residents in Indianapolis is nearly 10 times the rate for Hispanic residents and more than 5 times the rate for Asians.
- In Indianapolis, 1,326 white residents, 462 Black residents,18 Asian residents, and 30 Hispanic residents died of heart disease in 2022.
- From 2018 to 2022, the heart disease death rate has decreased slightly for Black residents, but the overall gap in race/ethnic groups is similar.
Trend Over Time
SAVI Reports Related to Heart Disease
How is Indy doing?
Ranking Indianapolis’ Heart Disease among 50 comparable cities
Race/Ethnic Group Ranking
27th White
14th Black
7th Hispanic
20th Asian
Racial Equity Ranking
Despite the large difference in heart disease death rates between white and other race groups, Indianapolis’ gap is smaller than more than half of its peers, ranking 19th out of 50.
Positively Trending City
Grand Rapids, MI ↑ 9 ranks
Top Cities
Green Bay, WI
Lafayette, IN
Providence, RI
Iowa City, IA
Springfield, MO
Driver of Life Expectancy
Infant Mortality
Infant mortality is the number of infant deaths before the age of one per 1,000 live births and is commonly used to measure the overall health of a community. According to the CDC, the five leading causes of infant mortality in the US were birth defects, Prenatal care, sudden infant death syndrome, injuries, and maternal pregnancy complications. Research on racial disparities in infant mortality in the U.S. conclude that social determinants of health play a significant role in infant mortality, suggesting programs that address factors such as education, healthcare access, and neighborhood conditions will have the greatest effect on reducing these disparities.
Closing the Gap and Key Takeaways
- Black babies have consistently had infant mortality rates that are 1.5 times higher than white and Hispanic babies.
- If infant mortality rates were equal for babies across all races, the result would have been nearly 25 fewer infant deaths per 1,000 live births in 2021.
Trend Over Time
SAVI Reports Related to Infant Mortality
How is Indy doing?
Ranking Indianapolis’ Infant Mortality among 50 comparable cities
Race/Ethnic Group Ranking
44th White
17th Black
N/A Hispanic*
31st Asian
*CDC does not provide ethnicity breakdown for infant mortality.
Racial Equity Ranking
Note: Estimated ranking due to incomplete data
The gap between white and other minority groups is smaller in Indianapolis than 34 of its 50 peers.
Positively Trending City
South Bend, IN ↑ 21 spots
Top Cities
Providence, RI
Austin, TX
South Bend, IN
Kalamazoo, MI
Wichita, KS
Driver of Life Expectancy
Drug Overdose Deaths
Indianapolis has seen a rise in drug overdose deaths, reflecting a broader national trend over the past decade. The opioid crisis has been responsible for a portion of this, and consequently has caused life expectancy to decline. In 2021, 228 Black residents died from an overdose compared to 471 white residents, but the rate per 100,000 population is higher for Black residents.
Closing the Gap and Key Takeaways
- Black residents in Indianapolis have an overdose death rate that is 4.1 times higher than Hispanic residents and 7.8 times higher than Asian residents.
- White residents, with a rate close to Black residents, consistently had the highest rates of overdose deaths until 2022.
- If the number of opioid related deaths were equal across all races, that would result in over 570 fewer deaths in Marion County in 2022.
- The drug overdose death rate steadily increased among Black residents, surpassing the death rate for white residents.
Trend Over Time
SAVI Reports Related to Drug Overdose Deaths
How is Indy doing?
Ranking Indianapolis’ Drug Overdose Deaths among 50 comparable cities
Race/Ethnic Group Ranking
50th White
38th Black
22nd Hispanic
30th Asian
Racial Equity Ranking
Indianapolis ranks in the top ten cities on equity in overdose deaths, with a smaller-than-average gap between white and minority groups. The ranking calculates an average gap between white and minority, weighted by population. Black residents make up a larger portion of the population, so its gap from white residents carries more weight than the larger gaps for Hispanic and Asians compared to white.
Positively Trending City
Dayton, OH ↑ 19 spots
Top Cities
Springfield, MO
Jacksonville, FL
San Jose, CA
Austin, TX
Lexington, KY
Driver of Life Expectancy
Alzheimer's Disease
Alzheimer’s Disease is the seventh-leading cause of death in the U.S, according to the Alzheimer's Association. Nationally, 10.6 percent of the population 65 and older have Alzheimer’s or associated dementia. Looking at prevalence by race, Black residents have the highest prevalence (13.8 percent), followed by Hispanic residents (12.2 percent) and non-Hispanic white residents (10.3 percent).
Closing the Gap and Key Takeaways
- In 2021, the rate of deaths related to Alzheimer’s for white residents was 1.7 times higher compared to Black residents, 4.4 times higher than Asian residents, and 15.5 times higher than Hispanic residents.
- If Alzheimer’s rates were equal for all populations, that would result in 193 fewer deaths in 2022.
- The death rate fluctuates between 2018 and 2022, but there was an overall decrease for white and Black residents and an increase for Asian residents during this time. The gap is between race/ethnic groups is narrowing.
Trend Over Time
SAVI Reports Related to Alzheimer's Disease
How is Indy doing?
Ranking Indianapolis’ Alzheimer's Disease among 50 comparable cities
Race/Ethnic Group Ranking
12th White
26th Black
7th Hispanic
25th Asian
Racial Equity Ranking
The gap between white and minority groups in Alzheimer’s death rates is larger in Indianapolis than 33 of the 50 comparison cities, with the white population having the highest rate.
Positively Trending City
Omaha, NE ↑ 23 spots
Top Cities
Iowa City, IA
Green Bay, WI
Lafayette, IN
Springfield, MO
South Bend, IN
Driver of Life Expectancy
Suicide
Suicide, suicidal thoughts, and suicidal behavior are affected by adverse conditions in which people live, grow, play, and work. Sometimes those conditions are also referred to as social determinants of health and can involve racism, lack of access to physical and mental healthcare services, abuse, bullying, and severe health conditions. White residents are much more likely to die from suicide than residents of other races.
Closing the Gap and Key Takeaways
- White residents are twice as likely to die from suicide compared to Black residents, and three and a half times as likely compared to Hispanic residents.
Trend Over Time
SAVI Reports Related to Suicide
How is Indy doing?
Ranking Indianapolis’ Suicide among 50 comparable cities
Race/Ethnic Group Ranking
37th White
19th Black
19th Hispanic
40th Asian
Racial Equity Ranking
*Hispanic rates are estimates due to low numbers.
Positively Trending City
Kansas City, MO ↑ 26 spots
Top Cities
Springfield, IL
Flint, MI
Green Bay, WI
Kansas City, MO
Omaha, NE
Driver of Life Expectancy
Homicide
In the United States, homicide is one of the major causes of death and contributes to health disparities. The burden of homicide is higher among racial and minority groups and are often linked to socioeconomic factors including poverty, income, neighborhood conditions, lack of education, and exposure to harmful chemicals and pollution.
Closing the Gap and Key Takeaways
- Black residents in Indianapolis are 8 times more likely to die from homicide than white residents.
- If homicide rates were equal for Black, white, and Hispanic populations, the result would have been 137 fewer deaths in 2022.
- There was an uptick in the homicide rate for Black residents in 2020. Though the rate is slowly declining, it is still higher than pre-COVID pandemic levels.
Trend Over Time
SAVI Reports Related to Homicide
How is Indy doing?
Ranking Indianapolis’ Homicide among 50 comparable cities
Race/Ethnic Group Ranking
45th White
40th Black
40th Hispanic
49th Asian
Racial Equity Ranking
*Hispanic rates are estimates due to low numbers.
Positively Trending City
Dayton, OH ↑ 27 spots
Top Cities
Lafayette, IN
Iowa City, IA
Erie, PA
Green Bay, WI
Madison, WI
How can we improve the Racial Equity Report Card? This is a link to a survey where you can provide your input on both the indicators you see tracked below or potential indicators that have not yet been considered. Thank you for providing feedback!
SAVI Reports Related to Health
 |
EconomyHow is Indianapolis Doing in Economy?Investing in an equitable economy has powerful benefits beyond the individuals that make up a city. Improved equity in job training/education, employment, workforce participation, access to good jobs, and living wage earnings will lead to more families who are thriving and able to contribute to the local economy. Unfortunately, many corporations’ hiring and pay processes have had a long history of racial discrimination – from excluding Black and Hispanic-dominated industries from wage protections, to barriers to employment and wage theft. Although community stakeholders have initiated policies to improve economic equity, Indianapolis still experiences differences in income and employment rates between racial groups. |
Median Household Income
The racial wealth gap is a complex issue that is influenced by many societal, governmental, and individual factors over time. These factors can play out over a person’s life cycle and even across generations. In 2020, the Brookings Institution found that nationally, the average Black family’s net worth was ten times less than the average white family’s.
Closing the Gap and Key Takeaways
- In Marion County, Asian and white households each make 1.7 times (about $ 30,000) more income than Black families per year in Indianapolis and 1.3 times (over $15,000) more than Hispanic households.
- If Black households earned the same amount as white households, that would be an average of $ 41,970 higher income for almost 140,000 households, resulting in $5.9 billion in additional income across Indianapolis.
- Despite the upward trend for all race groups from 2018 to 2022, the increase has been slower for Black residents, and the income gap between races continues to increase.
Trend Over Time
Map
To toggle between different races, click the > button.
SAVI Reports Related to Median Household Income
How is Indy doing?
Ranking Indianapolis’ Median Household Income among 50 comparable cities
Race/Ethnic Group Ranking
37th White
22nd Black
28th Hispanic
38th Asian
Racial Equity Ranking
The gap in income between white residents and non-white residents puts Indianapolis in the middle of the 50 comparison cities. Though Indianapolis white residents have a large advantage over most other races (making, for example, $30,000 more than Black residents), their advantage is average amongst the 50 cities.
Positively Trending City
Lexington, KY ↑ 19 ranks
Top Cities
San Jose, CA
Seattle, WA
Sacramento, CA
Springfield, MO
Green Bay, WI
Driver of Median Household Income
Unemployment Rate
Unemployment can vary widely from year-to-year based on larger-scale economic conditions. However, there are long-standing racial gaps in unemployment rates, regardless of economic changes over time.
Closing the Gap and Key Takeaways
- Black workers in Indianapolis are five times more likely to be unemployed than Asian workers, and 2.5 times more likely to be unemployed than white workers.
- If unemployment rates were equal across all races, that would result in over 27,000 additional employed workers.
- The unemployment rate dropped from 2018 to 2022 for all race and minority groups except Hispanic residents. Though disparities persist, the equity gap is shrinking.
Trend Over Time
Map
To toggle between different races, click the > button.
SAVI Reports Related to Unemployment Rate
How is Indy doing?
Ranking Indianapolis’ Unemployment Rate among 50 comparable cities
Race/Ethnic Group Ranking
26th White
28th Black
17th Hispanic
3rd Asian
Racial Equity Ranking
The gap in unemployment between white and other races is larger in Indianapolis than in 30 of the 50 comparison cities.
Positively Trending City
Louisville, KY ↑ 19 ranks
Top Cities
Seattle, WA
San Jose, CA
Austin, TX
Sacramento, CA
Springfield, MO
Related to Median Household Income
Poverty Rate
Poverty rate is the measure of individuals whose income is below the minimum level of income deemed necessary to meet basic needs such as food, shelter, clothing, and other essential expenses. In Indianapolis, a family of four living in poverty is surviving on an income below $27,750. Despite seeing decades of progress in addressing overall poverty rates nationwide, large racial gaps persist in Indianapolis.
Closing the Gap and Key Takeaways
- The poverty rate for Black residents in Indianapolis is more than double (2.3 times higher) on average than the rate for white residents, and the rate for Asian residents is 1.5 times higher on average than white residents. The gap between the rate for Hispanic and white residents is narrowing, dropping from 3 to 1.9 times the rate.
- If poverty rates were the same for Black and Hispanic individuals as white individuals, that would result in over 40,000 fewer people in poverty.
- Overall, the poverty gap between races is narrowing. This is partly driven by the large decline in the poverty rate for the Hispanic population.
Trend Over Time
Map
To toggle between different races, click the > button.
SAVI Reports Related to Poverty Rate
How is Indy doing?
Ranking Indianapolis’ Poverty Rate among 50 comparable cities
Race/Ethnic Group Ranking
34th White
12th Black
22nd Hispanic
36th Asian
Racial Equity Ranking
Indianapolis is doing better than 37 other cities on racial disparity in poverty. Even though disparities exist, the gap between white and non-white groups is smaller in Indy than in most cities.
Positively Trending City
Madison, WI ↑ 13 ranks
Top Cities
San Jose, CA
Springfield, MO
Iowa City, IA
Lansing, MI
Lafayette, IN
Labor Force Participation
Labor force participation is the percentage of people actively working or looking for work, divided by the working-age population. The combination of the labor force participation rate and median household income tells an interesting story, as many groups have the same participation rate, yet there are household income gaps. This is because getting a job is not enough on its own to create equity. Equity in access to quality jobs and wages are an important part of the solution.
Closing the Gap and Key Takeaways
- The labor force participation is nearly the same for all race groups. Given the data are based on five-year estimates, the differences are negligible.
- These equal participation rates suggest major gaps in wages, given the large income disparities by race.
Map
To toggle between different races, click the > button.
SAVI Reports Related to Labor Force Participation
How is Indy doing?
Ranking Indianapolis’ Labor Force Participation among 50 comparable cities
Race/Ethnic Group Ranking
35th White
35th Black
42nd Hispanic
39th Asian
Racial Equity Ranking
All race groups participate in the labor force at about the same rate, and this is typical when compared to other cities. Indianapolis ranks in the middle of the pack when comparing gaps by race in 50 cities.
Positively Trending City
Kansas City, MO ↑ 8 ranks
Top Cities
Washington, D.C.
San Francisco, CA
St. Louis, MO
Boston, MA
Nashville, TN
How can we improve the Racial Equity Report Card? This is a link to a survey where you can provide your input on both the indicators you see tracked above or potential indicators that have not yet been considered. Thank you for providing feedback!
SAVI Reports Related to Economy
 |
HousingHow is Indianapolis Doing in Housing?Housing is directly linked to long-term economic, education, and health outcomes for individuals, families, and communities. It also is the area where the greatest racial inequities are revealed. Everyone should have access to safe, affordable housing. Unfortunately, historical practices like redlining and residential segregation are still having an impact today, resulting in disparities in home loan approvals, home ownership rates, and housing affordability. A lack of policies to protect renters leads to high eviction rates, with people of color most impacted.
|
Homeownership Rate
Homeownership builds wealth and economic stability, providing long-term social and financial benefits for many families, increased civic engagement, and even improved mental health. Home ownership is not accessible for all in Indianapolis due to lack of affordability, access to loans, and other factors, and racial disparities persist.
Closing the Gap and Key Takeaways
- Sixty-six percent of white households own their home, which is nearly double the ownership rate of Black households and significantly higher than the Hispanic rate of 46 percent.
- If homeownership rates were equal between white, Hispanic, and Black households, that would result in over 37,000 more Black and Hispanic homeowner households.
- Since the average U.S. homeowner has $118,000 in home equity (Census), that could be an additional $4.4 billion in combined wealth for those households over time if the equity gap were closed.
- Between 2018 and 2022, home ownership rates increased for Hispanic and Asian residents but remained about the same for other race groups. The overall racial equity gap is about the same
Trend Over Time
Map
To toggle between different races, click the > button.
SAVI Reports Related to Homeownership Rate
How is Indy doing?
Ranking Indianapolis’ Home Ownership Rate among 50 comparable cities
Race/Ethnic Group Ranking
29th White
19th Black
26th Hispanic
13th Asian
Racial Equity Ranking
White residents have a clear advantage over minority groups in Indianapolis when it comes to home ownership. This advantage is comparable to the advantage white residents have in peer cities, with Indianapolis ranking in the middle of the 50 cities based on the size of the gap.
Positively Trending City
Providence, RI ↑ 13 ranks
Top Cities
San Francisco, CA
San Jose, CA
Denver, CO
Sacramento, CA
Wichita, KS
Driver of Homeownership Rate
Home Loan Denial Rate
For most people, if you can't get a loan, then you can't buy a home. Despite large efforts in eliminating discrimination from housing practices in the U.S., recent SAVI research has shown that residents of color are still more likely to have their home loan applications denied, even when controlling for other important variables.
Closing the Gap and Key Takeaways
- Black residents in Marion County are denied a home loan at nearly double the rate of white residents.
- If Black and Hispanic residents had the same home loan approval rate as white and Asian borrowers, this would result in over 980 more approved loans for borrowers each year.
- From 2018 to 2022, home loan denial rates fluctuated at about the same rate for all groups. The racial gaps remain unchanged.
Trend Over Time
SAVI Reports Related to Home Loan Denial Rate
How is Indy doing?
Ranking Indianapolis’ Home Loan Denial Rate among 50 comparable cities
Race/Ethnic Group Ranking
33rd White
23rd Black
24th Hispanic
20th Asian
Racial Equity Ranking
The disparity in home loan denials between white and minority groups is smaller in Indianapolis than it is in 33 of the 50 comparison cities.
Positively Trending City
Dayton, OH ↑ 7 ranks
Top Cities
Lafayette, IN
San Jose, CA
Sacramento, CA
Jacksonville, FL
Springfield, MO
Driver of Homeownership Rate
Housing Cost Burden
A person is considered "housing cost-burdened" if they spend more than 30% of their income on housing. This rate varies by renter and owner with 51% of renters being housing-cost burdened compared to 19% of owners. It also varies by race as noted below. Addressing these disparities requires policies and practices that include increasing affordable housing inventory, promoting fair housing prices, improving access to financial resources and homeownership opportunities, and addressing income inequalities.
Closing the Gap and Key Takeaways
- Studies have shown that minority households, particularly Black and Hispanic families, are more likely to experience higher housing cost burden compared to white families.
- In Indianapolis, the percent of Black and Hispanic families who are housing cost-burdened is around 1.2 times higher compared to white and Asian families.
- If the housing-cost burden rate was equal for Hispanic, Black, and white households, then 10,500 fewer people would be housing cost-burdened.
- From 2018 to 2022, the housing cost burden lessened for most groups, but the racial gap has widened slightly.
Trend Over Time
SAVI Reports Related to Housing Cost Burden
How is Indy doing?
Ranking Indianapolis’ Housing Cost Burden among 50 comparable cities
Race/Ethnic Group Ranking
41st White
36th Black
42nd Hispanic
29th Asian
Racial Equity Ranking
The disparity between white and minority groups for housing cost burden is smaller in Indianapolis than in 33 of the 50 comparison cities.
Positively Trending City
St. Louis, MO ↑ 21 ranks
Top Cities
Lexington, KY
Sacramento, CA
Iowa City, IA
Lafayette, IN
Springfield, MO
Other Housing Indicator
Eviction Filing Rate
The effects of eviction can be significant and long-lasting, resulting in the personal loss of possessions, one’s neighborhood, and children’s schools, while increasing childhood trauma, negative health outcomes, and stress. Even an eviction filing that does not result in an eviction can hurt a tenant’s prospects for finding a new apartment.
Closing the Gap and Key Takeaways
- Despite the eviction rates being similar for Black, Hispanic, and white residents in Indianapolis, many black renters (1 in 4 nationally) live in areas in which the black eviction rate is more than double the white eviction rate.
- If eviction rates for Black and Hispanic households were equal to those in white households, the result would be nearly 1,563 fewer evictions in Indianapolis.
SAVI Reports Related to Eviction Filling Rate
How is Indy doing?
Ranking Indianapolis’ Eviction Filing Rate among 50 comparable cities
Race/Ethnic Group Ranking
50th White
50th Black
50th Hispanic
N/A Asian*
*Data on Asian eviction rate is not available.
Racial Equity Ranking
Note: Estimated ranking due to incomplete data
Renters in Indianapolis are evicted at a similar rate across white, Black, and Hispanic renters. It ranks 9th among 13 comparison cities, meaning the gap between races is slightly larger than in Indianapolis than the other comparison cities.
Positively Trending City
Indianapolis, IN ↑ 7 ranks
Top Cities
Minneapolis, MN
Pittsburgh, PA
How can we improve the Racial Equity Report Card? This is a link to a survey where you can provide your input on both the indicators you see tracked below or potential indicators that have not yet been considered. Thank you for providing feedback!
SAVI Reports Related to Housing
 |
Criminal JusticeHow is Indianapolis Doing in Criminal Justice?People of color make up a disproportionate percentage of the prison population, fueled by inequities throughout all stages of the justice system - from the cradle-to-prison pipeline to racial and ethnic disparities during the arrest, incarceration, and sentencing process. Incarceration has long-term effects on the incarcerated individuals, families, and their communities, leading to a further disadvantage for those impacted. |
Jail Population Rate
Jail is typically used to incarcerate a person who has been arrested for an alleged crime while they await their trial. Despite there being fewer Marion County residents in jail than in prison, the jail population is a significant portion of the incarcerated population. Most people in Marion County jails (67%) are there on low-level felonies, which are more severe than a misdemeanor and include such things as theft, unlawful possession of a syringe, and possession of a narcotic drug. Addressing these low-level crimes represents the best opportunity to reduce the jail population significantly.
Closing the Gap and Key Takeaways
- Black residents make up over half of the jail population per 100,000 people aged 15 to 64.
- If Black individuals were jailed at the same rate as white individuals, that would result in 1,454 more people free from jail at any given time.
- The disparities by race have remained consistent over time.
Trend Over Time
SAVI Reports Related to Jail Population Rate
How is Indy doing?
Ranking Indianapolis’ Jail Population Rate among 50 comparable cities
Race/Ethnic Group Ranking
42nd White
23rd Black
24th Hispanic
10th Asian
Racial Equity Ranking
Note: Estimated ranking due to incomplete data
Despite Indianapolis’ large disparity by race in who is jailed, this disparity is the 8th smallest equity gap out of 50 cities, which means that there are only 7 other cities in the comparison that are more equitable than Indianapolis. This is driven in part by the fact that Indianapolis’ white residents have one of the highest rates of jailing among these cities.
Positively Trending City
South Bend, IN ↑ 25 ranks in the last 4 years
Top Cities
Jacksonville, FL
Springfield, MO
Lafayette, IN
Evansville, IN
South Bend, IN
Driver of Jail Population Rate
Incarceration Rate
The total incarceration rate, including both people in jail and prison, is much higher for Black residents of Marion County than for white residents. The latest data available by race at the county level for jail and prison rates is 2016. At that time, Marion County's incarceration rate was lower than the national rate. Our incarceration gap was slightly lower than the national rate: the Black incarceration is 4.0 times higher than White in Marion County and 4.2 times higher in the nation overall.
Closing the Gap and Key Takeaways
- This is one of the largest equity gaps among all the indicators examined in the report card.
- The incarceration rate for Black residents is 4.0 times higher than for white residents in Marion County and 4.2 times higher in the nation overall.
- If Black residents were incarcerated at the same rate as white residents, there would be 5,000 more people living in their communities rather than incarcerated.
SAVI Reports Related to Incarceration Rate
Driver of Jail Population Rate
Juvenile Charges
The Juvenile Detention Alternatives Initiative began in Marion County in 2006 and has dramatically reduced the number of juvenile charges in our city. However, substantial racial inequity exists for Indianapolis’ young people. For every white youth charged, there are two Hispanic youths and over five Black youths charged with crimes.
Closing the Gap and Key Takeaways
- If Black youth were charged at the same rate as white youth, the result would be nearly 664 fewer juvenile charges each year.
- For every white young person facing criminal charges, there are 4 Black young people being charged.
- There has been little change in the rate of charges for white youth but a growing rate for Black youth. The gap between races has grown wider over the last five years.
Trend Over Time
SAVI Reports Related to Juvenile Charges
Driver of Jail Population Rate
School Suspensions
Removing children from school for even a few days disrupts their education and can increase their chances of entering the criminal justice system. Studies have shown a child who has been suspended is more likely to be retained in grade, drop out, commit a crime, and interface with the juvenile justice system.
Closing the Gap and Key Takeaways
- Black students are twice as likely as white students to have in-school suspensions and four times more likely to have out-of-school suspensions. Black students are serving suspensions out-of-school over three times as much as they are serving suspensions in-school.
- If Black children were suspended at the same rate as white children, the result would be 3,000 fewer suspensions each year.
SAVI Reports Related to School Suspensions
How can we improve the Racial Equity Report Card? This is a link to a survey where you can provide your input on both the indicators you see tracked below or potential indicators that have not yet been considered. Thank you for providing feedback!
SAVI Reports Related to Justice
 |
EducationHow is Indianapolis Doing in Education?Attaining an education can have many economic, social, and personal benefits, and is linked to higher earnings and better employment options. However, not everyone has equal access to this opportunity. High school and postsecondary degree attainment can be affected by factors such as funding, access to tools and technology, and geographic location. Indianapolis' educational inequity has sparked community and policy changes, such as schools partnering with educational justice initiatives to increase college readiness.
|
Bachelor's Degree Attainment
Despite national conversations questioning the value of a college degree in today's economy, the fact remains that a degree usually leads to greater economic success. Higher bachelor's degree attainment levels among Asian and white residents are key drivers behind higher median incomes for those groups.
Closing the Gap and Key Takeaways
- If Black and Hispanic residents had bachelor's degrees at the same rate as Asian residents, that would result nearly 54,000 more people with a bachelor's degree.
- Because someone with a bachelor's degree earns on average $20,000 per year more than someone with just a high school diploma, that could equate to as much as $1.08 billion in additional earnings across Indianapolis.
- From 2018 to 2022, there was little change in college attainment rates by race and thus little change in the racial equity gap that exists.
Trend Over Time
Map
To toggle between different races, click the > button.
SAVI Reports Related to Bachelor's Degree Attainment
How is Indy doing?
Ranking Indianapolis’ Bachelor's Degree Attainment among 50 comparable cities
Race/Ethnic Group Ranking
30th White
26th Black
42nd Hispanic
44th Asian
Racial Equity Ranking
The gap between white and minority adults for bachelor's degree attainment ranked Indianapolis 36th out of 50 cities, meaning the disparity is large enough to place Indianapolis near the bottom quarter of all ranked cities.
Positively Trending City
South Bend, IN ↑ 10 ranks
Top Cities
Lafayette, IN
Champaign, IL
Springfield, MO
Lansing, MI
Seattle, WA
Related to Bachelor's Degree Attainment
Postsecondary Degree Attainment
Rather than looking at only traditional four-year bachelor's degrees, this report card focuses on a more inclusive education measurement. Graduating with any level of college degree has major economic benefits such as increased earnings over a worker's lifespan. Postsecondary degree attainment captures everyone who has earned at least an associate degree up through those with post-graduate degrees. Obtaining credentials and training are a better option than college for some residents. However, data about these education options are limited and are not included in this report.
Closing the Gap and Key Takeaways
- If Black and Hispanic adults had post-secondary degrees at the same rate as white adults, that would result in over 37,000 more people with at least an associate degree.
- Even though they have the highest attainment, less than half of all white adults 25 and over in Indianapolis have a degree past high school. Overall, adults in Indianapolis have low attainment, with surrounding counties having levels ranging from 5 to 25 percentage points higher.
SAVI Reports Related to Postsecondary Degree Attainment
Driver of Bachelor's Degree Attainment
High School Diploma Attainment
College is not for everyone. There are still good jobs available for those with only a high school diploma; however, there is a large gap in diploma attainment by race which creates an under-represented applicant pool. Black and Hispanic residents in Indianapolis have a higher percentage of people with only a high school diploma compared to other groups.
Closing the Gap and Key Takeaways
- Hispanic adults in Indianapolis have the lowest education level, with 38% not completing high school and 29% completing only high school.
- While Asian adults are more likely to obtain the highest education levels of all race groups in Indianapolis, Black adults have near the lowest higher education rate and are twice as likely as Asians to have only a high school education.
- Because someone with a high school diploma on average earns $5,000 per year more than someone without, having equity in high school degree attainment could equate to as much as $322 million in additional earnings across Indianapolis.
Map
SAVI Reports Related to High School Diploma Attainment
How is Indy doing?
Ranking Indianapolis’ High School Diploma Attainment among 50 comparable cities
Race/Ethnic Group Ranking
32nd White
36th Black
34th Hispanic
39th Asian
Racial Equity Ranking
The disparity between white and minority groups in Indianapolis is larger than 22 other cities, or just a little under the average out of 50 cities.
Positively Trending City
Wichita, KS ↑ 14 ranks
Top Cities
Lafayette, IN
Champaign IL
Springfield, MO
Green Bay, WI
South Bend, IN
Other Education Indicator
Reading Proficiency Rate (Grades 3-8)
ILEARN stands for Indiana’s Learning Evaluation and Assessment Readiness Network and tracks the progress made by Indiana students towards standards set by the Indiana Department of Education. One of those standards is the English/Language Arts (ELA) Proficiency Rate, which is the rate for which students are proficient in utilizing the English Language as defined by the Indiana Department of Education. A quick look at the data suggests a lack of equity across race groups.
Closing the Gap and Key Takeaways
- If Black and Hispanic students tested at the same rate as Asian students, they would be considered proficient at more than twice the rate as they are now. This would be an additional 7,655 Black and 4,819 Hispanic students proficient in English/Language arts.
- According to Pew Research, 72% of the Asian population is English proficient, and 66% of Asians speak a language other than English in their home. Yet Asian students have the highest English proficiency rate in Indianapolis.
- Reading proficiency in Indianapolis has declined for all race groups in Indianapolis since 2019, and the wide race gap persists.
Trend Over Time
SAVI Reports Related to Reading Proficiency Rate (Grades 3-8)
How is Indy doing?
Ranking Indianapolis’ Reading Proficiency Rate among 50 comparable cities
Race/Ethnic Group Ranking
42nd White
16th Black
32nd Hispanic
31st Asian
Racial Equity Ranking
Note: Estimated ranking due to incomplete data
There is a large racial disparity in Reading proficiency rates for students in grades 3 through 8 in Indianapolis. However, Indianapolis ranks near the top of the 50 comparison cities for equity in reading outcomes, because the size of the racial gap is smaller than 41 of 50 comparison cities.
Positively Trending City
N/A
Top Cities
Springfield, MO
Seattle, WA
Champaign, IL
Jacksonville, FL
Providence, RI
Other Education Indicator
Math Proficiency Rate (Grades 3-8)
In much the same way as ELA proficiency, ILEARN’s Math Proficiency Rate follows a pattern of inequity across the community, almost identical to the pattern for the ELA Proficiency Rate. Hispanic and Black students are struggling more than other students to achieve proficiency in these standards.
Closing the Gap and Key Takeaways
- If Black and Hispanic students tested at the same rate as Asian, they would be considered proficient at more than twice the rate as they are now. This would mean an additional 9,102 Black and 5,297 Hispanic students would be proficient in math.
- Asian students are 4 times more proficient than Black students in math.
- Math proficiency in Indianapolis has declined for all race groups in Indianapolis since 2019, and the wide race gap persists.
Trend Over Time
SAVI Reports Related to Math Proficiency Rate (Grades 3-8)
How is Indy doing?
Ranking Indianapolis’ Math Proficiency Rate among 50 comparable cities
Race/Ethnic Group Ranking
32nd White
12th Black
17th Hispanic
37th Asian
Racial Equity Ranking
Note: Estimated ranking due to incomplete data
There is a large racial disparity in Math proficiency rates for students in grades 3 through 8 in Indianapolis. However, Indianapolis’ racial gap is smaller than 32 of 50 comparison cities, giving it a better equity ranking.
Positively Trending City
N/A
Top Cities
Lafayette, IN
Seattle, WA
Springfield, MO
Champaign, IL
Jacksonville, FL
How can we improve the Racial Equity Report Card? This is a link to a survey where you can provide your input on both the indicators you see tracked below or potential indicators that have not yet been considered. Thank you for providing feedback!
SAVI Reports Related to Education
 |
AccessHow is Indianapolis Doing in Access to Community Assets?Having access to important community resources - from food to transportation to internet - can have significant impacts on an Individual’s health, education, and employment opportunities. These resources are not spread equitably; people of color have the worst access to the resources tracked here. Creating policies to promote equitable access can help more Indianapolis residents participate in these opportunities more often. |
Transportation Access (Transit + Car)
Access to public transit is not universal. An estimated 13,000 Black and Hispanic households are without a car and have low access to public transit (that is, they live outside high-transit neighborhoods). High-transit neighborhoods are census tracts with more than 1,000 miles of bus service in a week per square mile according to SAVI's transit density measure. Only one-fourth of census tracts in Indianapolis are considered high-transit.
Closing the Gap and Key Takeaways
- Black households are likely to be without a car and live outside a transit-rich neighborhood at the 1.6 rate of white households.
- Hispanic households are 33% more likely to be without a car and live outside a transit-rich neighborhood compared to white households.
- If the rate were equal for Black and white households, that would result in over 4,200 more households with better transportation access.
- Access to transportation improved slightly from 2018 to 2022, but the racial gap remains about the same.
Trend Over Time
SAVI Reports Related to Transportation Access (Transit + Car)
How is Indy doing?
Ranking Indianapolis’ Transportation Access among 50 comparable cities
Race/Ethnic Group Ranking
24th White
20th Black
20th Hispanic
24th Asian
Racial Equity Ranking
Indianapolis ranks ‘good’ on equity in transportation access. The gap between white and non-white residents puts Indianapolis at a ranking of 17th out of 50 compared to the gap in other cities.
Positively Trending City
Charlotte, NC ↑ 14 ranks
Top Cities
San Francisco, CA
Denver, CO
Boston, MA
Washington, D.C.
San Jose, CA
Other Access Indicator
Broadband Internet Access
Access to reliable, high-speed internet is vital to succeeding in today's online world. It improves access to jobs, education, healthcare, and more. Despite recent efforts to expand broadband in Indiana, residents of color are still less likely to have access, even in a big city like Indianapolis.
Closing the Gap and Key Takeaways
- Not only do Black households have lower broadband access, they also are twice as likely to have no computer device than other race groups.
- If internet access were equal for Black and white households, that would result in 7,741 more households with broadband internet at home.
- Internet access improved for all race groups from 2018 to 2022, and the racial disparities have improved.
Trend Over Time
Map
To toggle between different races, click the > button.
SAVI Reports Related to Broadband Internet Access
How is Indy doing?
Ranking Indianapolis’ Broadband Internet Access among 50 comparable cities
Race/Ethnic Group Ranking
30th White
36th Black
43rd Hispanic
44th Asian
Racial Equity Ranking
Equity in broadband access is worse in Indianapolis than 41 other cities. That means the gap between white residents and other race groups for broadband access is much wider in Indianapolis than in most other comparison cities.
Positively Trending City
Fort Wayne, IN ↑ 20 ranks
Top Cities
Lafayette, IN
Iowa City, IA
Madison, WI
Providence, RI
San Jose, CA
Related to Internet Access
Smartphone Access
Internet access at home improves access to jobs, education, and other resources, but desktop and laptop computers can be cost prohibitive for people with less wealth and income. A smartphone can be a cheaper way to access the internet both at home and using free public Wi-Fi.
Closing the Gap and Key Takeaways
- In Indianapolis, Black residents are five times more likely to be without a smartphone than Asian residents who have the greatest access, and Hispanic residents are nearly four times more likely than Asians to be without a smartphone.
- If smartphone access were the same for Black and Hispanic individuals as it is for Asian individuals, that would result in nearly 40,000 more residents with a smartphone.
- Access to a smartphone improved from 2018 to 2022, but the racial gap remains the same.
Trend Over Time
SAVI Reports Related to Lack of Smartphone Access
How is Indy doing?
Ranking Indianapolis’ Smartphone Access among 50 comparable cities
Race/Ethnic Group Ranking
28th White
32nd Black
40th Hispanic
26th Asian
Racial Equity Ranking
Like broadband access, Indianapolis ranks poorly on equity in access to a smartphone. The gap between white and other race groups is wider in Indianapolis than in 39 other comparison cities.
Positively Trending City
Peoria, IL ↑ 21 ranks
Top Cities
Lansing, MI
Providence, RI
Madison, WI
Sacramento, CA
San Jose, CA
Other Access Indicator
Healthy Food Access
Lack of access to fresh, high-quality food can influence many factors later in life, including health and overall wellbeing. Indianapolis has many ‘food deserts’, which are neighborhoods without healthy and affordable food available to the public within a reasonable travel distance from home. There is a stark difference comparing the share of people living in a food desert by race.
Closing the Gap and Key Takeaways
- One in four Black Indianapolis residents lack access to healthy, affordable food as opposed to only one in ten white residents.
- If Black residents had the same access to healthy food as white residents, at least 35,210 more people would have access to healthy food.
SAVI Reports Related to Healthy Food Access
How can we improve the Racial Equity Report Card? This is a link to a survey where you can provide your input on both the indicators you see tracked below or potential indicators that have not yet been considered. Thank you for providing feedback!
SAVI Reports Related to Access
 |
EnvironmentHow is Indianapolis Doing in Environment?While harmful environmental impacts such as aerial toxins, pollution, and hazardous waste can affect everyone, some are more affected than others. Studies have shown that marginalized racial groups are more likely to live near waste facilities and plants, which can have significant effects on health. "Environmental racism" has emerged as a concept to shed light on these inequalities and address their systemic nature.
|
Environmental Burden
Environmental burden can be described as any significant or negative impact to a community’s clean air, water, and land from intentional or foreseeable causes. Examples include pollution from industrial activities, emissions from vehicles, lack of access to parks, and noise pollution from airports and high-volume roads. These burdens can cause cumulative negative impacts on people residing in these communities, including poorer health.
Identifying communities facing disparate impacts is critical to advancing health equity. Environmental burdens are inequitably distributed between race groups, with some groups experiencing greater exposure than others due to their neighborhood of residence.
Closing the Gap and Key Takeaways
- Hispanic neighborhoods experience the highest negative environmental exposures while Asian neighborhoods experience the lowest.
- Environmental burden rates for Hispanic residents are steadily increasing relative to other race/ethnic groups AND relative to peers in other cities. In Indianapolis, this is due in part to a population shift from low-exposure areas (e.g., Michigan-Highlands) into high-exposure areas (e.g., Near Westside).
- Asian residents have the lowest average exposure relative to other race/ethic groups, in large part due to the high population of Asian residents in Perry Township, which is one of the environmentally safest areas in Marion County according to this metric.
- Closing the equity gap on environmental burden could take several forms: development of affordable housing in low-exposure areas, policies that provide targeted support for green spaces, cleanup, preventative health screening, and/or zoning protections in Hispanic neighborhoods.
SAVI Reports Related to Environmental Burden
How is Indy doing?
Ranking Indianapolis’ Environmental Burden among 50 comparable cities
Race/Ethnic Group Ranking
44th White
38th Black
47th Hispanic
38th Asian
Racial Equity Ranking
The racial gap in negative environmental exposure between white residents and minority residents is smaller in Indianapolis than 40 other cities.
Positively Trending City
Washington, D.C. ↑ 6 ranks
Top Cities
Boston, MA
San Francisco, CA
Lafayette, IN
Evansville, IN
Denver, CO
Other Environment Indicator
Toxic Release by Census Tract
This dashboard shows the amount of toxic chemicals released into the air by toxic release sites. The map displays the amount released by census tract. Clicking on a tract allows you to view the race of the population in that community. Several of the tracts most impacted are predominantly black communities.
SAVI Reports Related to Toxic Release by Census Tract
How can we improve the Racial Equity Report Card? This is a link to a survey where you can provide your input on both the indicators you see tracked below or potential indicators that have not yet been considered. Thank you for providing feedback!
SAVI Reports Related to Environment
Conclusion
“Where justice is denied, where poverty is enforced, where ignorance prevails, and where any one class is made to feel that society is an organized conspiracy to oppress, rob and degrade them, neither persons nor property will be safe.”
The Indianapolis Racial Equity Report Card provides an overview of the current state of racial disparities and inequities in Indianapolis. It highlights the areas where progress has been made and where further action is needed to ensure equitable opportunities and outcomes for all Indianapolis residents, regardless of race. By using this report card as a tool for accountability and advocacy, we can work towards creating a more just and equitable society for all.
The Report Card and Its Use
This report card is a tool to inform decisions and policies that can make a positive difference. It highlights the areas where change is needed most. While we acknowledge the past, our focus is on the future. By comparing the disparities in Indianapolis to our peers, we can identify areas where we are not as successful and learn what other cities are doing differently that may work here. This tool can help identify where levers can be pulled to make the biggest impact.
Here are some ways in which the tool can be used to identify and address gaps:
- Advocacy: Data-driven policy changes and initiatives that address disparities and inequities in your community are important. This report card can be centered in conversations with policymakers, community leaders, and stakeholders to raise awareness and build support for targeted innovations and solutions that promote racial equity.
- Accountability: This actionable tool can be used to hold institutions, organizations, and agencies accountable for their commitments to racial equity by using the report card to track community progress and outcomes. Community leaders, business leaders, and community advocates can identify where improvements are needed, find cities that are doing well in those areas to see what can be learned about their approach, and monitor key indicators and benchmarks to assess whether local efforts to address inequities are making a difference.
- Education: The Indianapolis Racial Equity Report Card can be used as an educational tool to raise awareness and deepen understanding of racial disparities and inequities. Leaders can organize workshops, trainings, and presentations to discuss the findings and recommendations of the report card and engage community members in conversations about how to advance racial equity and social justice.
An equitable society has several benefits:
- Economic benefits: By addressing systemic barriers that hold back marginalized communities, our community can help unlock the full potential of all individuals and contribute to a stronger economy.
- Strengthening communities: Racial equity is essential for building strong and cohesive communities. By promoting inclusivity and addressing disparities, Indianapolis neighbors can help foster a sense of unity and social cohesion that benefits all members of society.
- Upholding American values: The principles of equality and fairness are core American values that make up the tapestry of our American culture. Ensuring racial equity aligns with these values and demonstrates a commitment to creating a society where all individuals have equal opportunities to succeed, which is critical to upholding the United States of America’s most precious asset - its people.
Understanding all that influences racial equity is necessary for making progress in our increasingly multiracial society. By actively working towards a more equitable society, Indianapolis neighbors everywhere can help create a stronger, more prosperous, and more inclusive Indianapolis.
Share your feedback!
We continue to improve the report card based on feedback. Please fill out this survey to provide input on the indicators we selected, what you think is missing, and general feedback about the report card. Thank you!
Contributors
The Polis Center, Indiana University Indianapolis
Sharon Kandris, S M Asger Ali, Kayla Duncan, Allison Kraus, Marc McAleavey, Allyson Scott, and student Jesse Colbert
The following individuals contributed to an early draft of the report card: Matthew Dietrich, Matt Nowlin, Aaron Olson, and students Ted Deitz and Jeffery Grogan.

InfoGraphics Lab, University of Oregon
This team has been an invaluable partner in the ideation, research, analysis, and visualization of data in this report.
Erik Steiner, Joanna Merson, and student Lily Lindros.
Acknowledgments
Thank you to the hundreds of people who provided input throughout the drafting and refinement of this report card. And thank you to a group of advisors who provided input early in the drafting process:
Indianapolis Government Alliance on Race and Equity
SAVI Equity Research Committee:
Imhotep Adisa, Executive Director, Kheprw Institute; Rachel Santos, Director of Education Policy, Indiana Latino Institute; Gurinder Hohl, CEO Immigrant Welcome Center; Allison Luthe, Executive Director, MLK Center Indy; Robin Turner, Associate Professor of Political Science, Butler University; Carly Weidman, Manager of Community Engagement, WFYI
Methodology
Comparison Cities
The following fifty cities are used in our rankings:
Geographic scale
To maximize data compatibility and availability, we used data at the county level. For each city, the primary county in which the city resides is used as the geographic unit. For Indianapolis, which has an analogous geographic relationship with Marion County, this approach is especially useful. This decision is also in response to community feedback, which emphasized the importance of data availability at a local scale.
Capitalization of race
We follow IU’s style guide for capitalization to determine how to capitalize race groups.
Hispanic
This racial equity report card includes a Hispanic category, even though it is an ethnicity. The white race group does not include those with Hispanic ethnicity (it includes only non-Hispanic white), while the other race groups include those who also are Hispanic or Latino.
Race-specific rankings
To determine the Race/Ethnic Group Ranking for a given indicator, we compared the value for the race across 50 cities and ranked them one to fifty. A rank of one for Indianapolis means that race is doing better in Indianapolis than in other cities on that indicator. A rank of fifty for Indianapolis means that race is doing worse in Indianapolis than in all other cities on that indicator.
Overall city ranking
This compares the size of the disparity between white residents and minority residents in Indianapolis to other cities. To determine the ranking in each city, first we calculated a ratio for each race compared to white (raw value for race divided by raw value for white). Then we averaged the ratios across all minority groups in the city, weighted by the total population of each group. This means that the size of the disparities for small race groups do not count as much as the size of the disparities for large race groups. Finally, we ranked the average disparities from 1 to 50. A rank of one for Indianapolis means it is the most equitable city, that is, the gap between white and minorities for that indicator is smaller in Indianapolis than any other city. A rank of fifty for Indianapolis means it is the least equitable city, or the gap between white and minorities is the largest in Indianapolis among all 50 cities.
Because these rankings measure gaps, these numbers are inherently interdependent. For example, if the white rank for a given indicator suddenly goes down, it will cause other groups’ ranks to rise - because the gap between the race groups has decreased, regardless of whether the change was negative or positive, or whether the raw values have improved. It is therefore important to think about these rankings within a broader context of disparity within Indianapolis.
For some indicators, data is not available for all 50 cities. In these instances, we estimated the ranking among 50 cities based on the position within the cities for which we have data. The following is a list of impacted indicators and the number of cities used for each:
- Eviction Filing Rate (14 cities)
- Infant Mortality Rate (39 cities)
- Jail Population Rate (49 cities)
- Life Expectancy (46 cities)
- Math Scores (46 cities)
- Reading Scores (46 cities)
Top cities
This lists the top five cities with the smallest disparity between white and other race groups. A top-ranking city does not mean there is not more work to do in that area to increase racial equity. It simply means that among 50 cities, these cities had the smallest racial gap for a given indicator. The intention of displaying high-ranked cities is to provide a starting point for thinking about how these cities differ from Indianapolis in their approach or other factors, and what can be done to improve racial equity in Indianapolis.
Positively trending city
We compared each city’s ranking this year to five years ago (in some cases fewer years based on available data). The selected city showed the greatest improvement by going up the most ranks during that time. The intention of including this information is to provide a city that may be worth further investigation to learn if there is something intentional in its approach to improving equity for this indicator that Indianapolis may want to explore.
End Notes
Notation from paragraph 1 in Introduction:
Some of this growth has been driven by an increase in the number of people selecting multiple races on census forms, but growth has also been strong among people who identify only as Black, Hispanic, or Asian.
Data sources
Most indicators in this report were sourced from American Community Survey (ACS) and Census data for consistency and comparability across cities.
The indicators “Postsecondary Degree Attainment”, “Juvenile Charges”, “School Suspensions”, and “Population Living in a Food Desert” do not use readily accessible data from national sources but nevertheless were included based on community feedback. These indicators are sourced from SAVI analysis of local and national data.
| Theme | Indicator | Data Source |
| Population by Race & Ethnicity | Race & Ethnicity | ACS 5-YR Data, 2018-2022 |
| Economy | Median Household Income (Key Indicator) | |
| Unemployment Rate | ||
| Poverty Rate | ||
| Labor Force Participation Rate | ||
| Access | Transportation Access (Transit + Car) (Key Indicator) | ACS and PUMS, 2022 |
| Broadband Internet Access | ACS 5-YR Data, 2018-2022 | |
| Smartphone Access | ACS 5-YR Data, 2017-2021 | |
| Food Desert Population by Race | 2022 SAVI Community Information System | |
| Health | Life Expectancy at Birth (Key Indicator) | National Center for Health Statistics 2021 |
| Health Insurance Access | ACS 5-YR Data, 2018-2022 | |
| Diabetes | CDC Wonder, 2022 | |
| Heart Disease | ||
| Infant Mortality | ||
| Drug Overdose Deaths | ||
| Alzheimer disease | ||
| Suicide | ||
| Homicide | ||
| Housing | Homeownership Rate (Key Indicator) | ACS 5-YR Data, 2018-2022 |
| Home Loan Denial Rates | Federal Institutions Examination Council Data 2022 | |
| Housing Cost Burden | ACS 5-YR Data, 2018-2022 | |
| Eviction Rate | Eviction Lab, 2024 | |
| Education | Bachelor’s Degree Attainment (Key Indicator) | ACS 5-YR Data, 2018-2022 |
| Postsecondary degree attainment | 2021 ACS 1-YR associate degree or Higher | |
| High School Graduation Rate | ACS 5-YR Data, 2018-2022 | |
| ILEARN ELA Proficiency Rate | SAVI, 2023 | |
| ILEARN Math Proficiency Rate | ||
| Environment | Environmental Burden (Key Indicator) | EJI+ACS+Race Tract, 2022 |
| Cumulative Environmental Impacts | Environmental Justice Mapping Tool, 2021 Vera Institute, 2021 | |
| Justice | Jail Population Rate (Key Indicator) | Vera Institute, 2021 |
| Incarceration Rate | Vera Institute, 2016 | |
| Juvenile Charges | Marion County Superior Court, 2020 | |
| School Suspensions | Indiana Department of Education |