Getting Groceries
Food Access Across Groups, Neighborhoods, and Time
COMMUNITY TRENDS | FALL 2019
Executive Summary
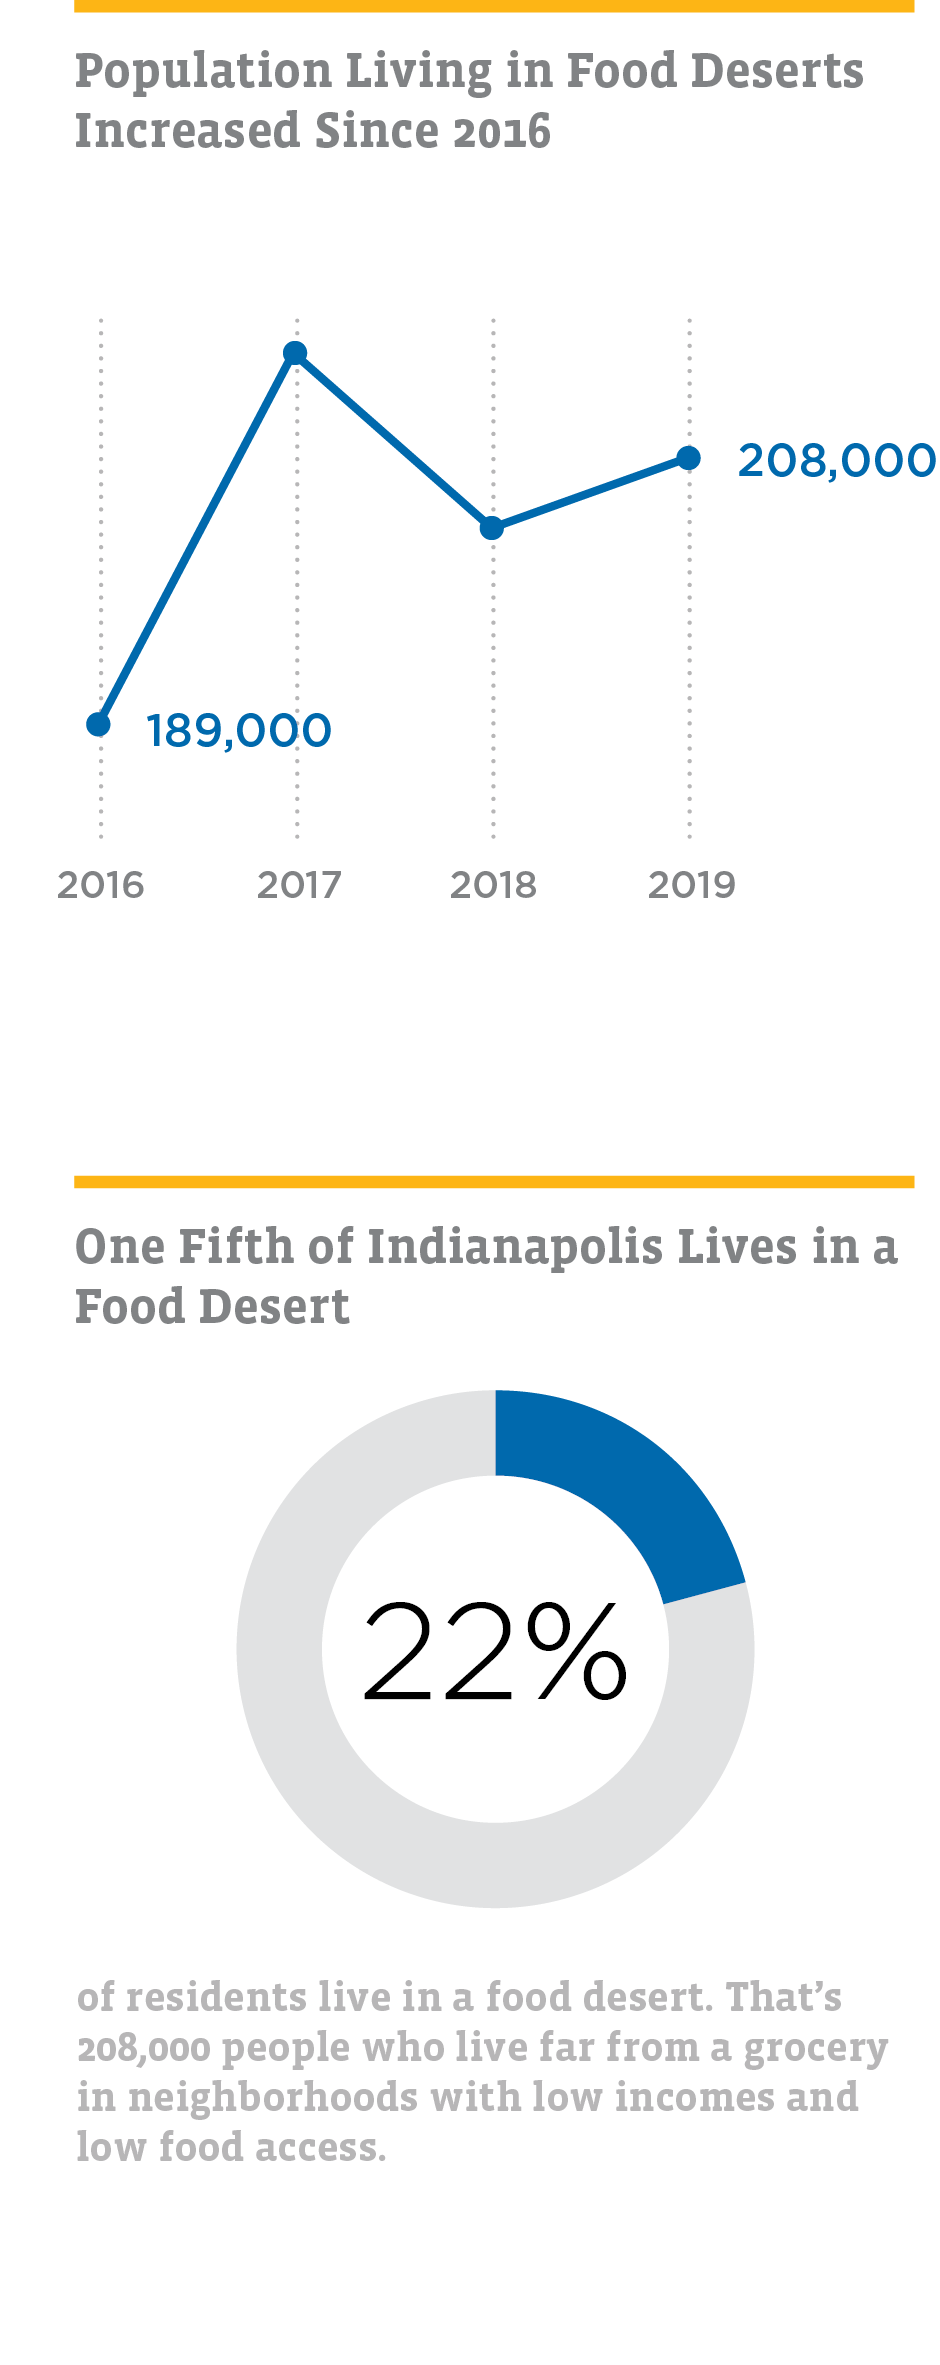
When people do not have access to healthy food, this can impact their diet, their health, and their quality of life. Food deserts are a way of defining communities that lack healthy food access. These are neighborhoods with both low healthy food access and low income.
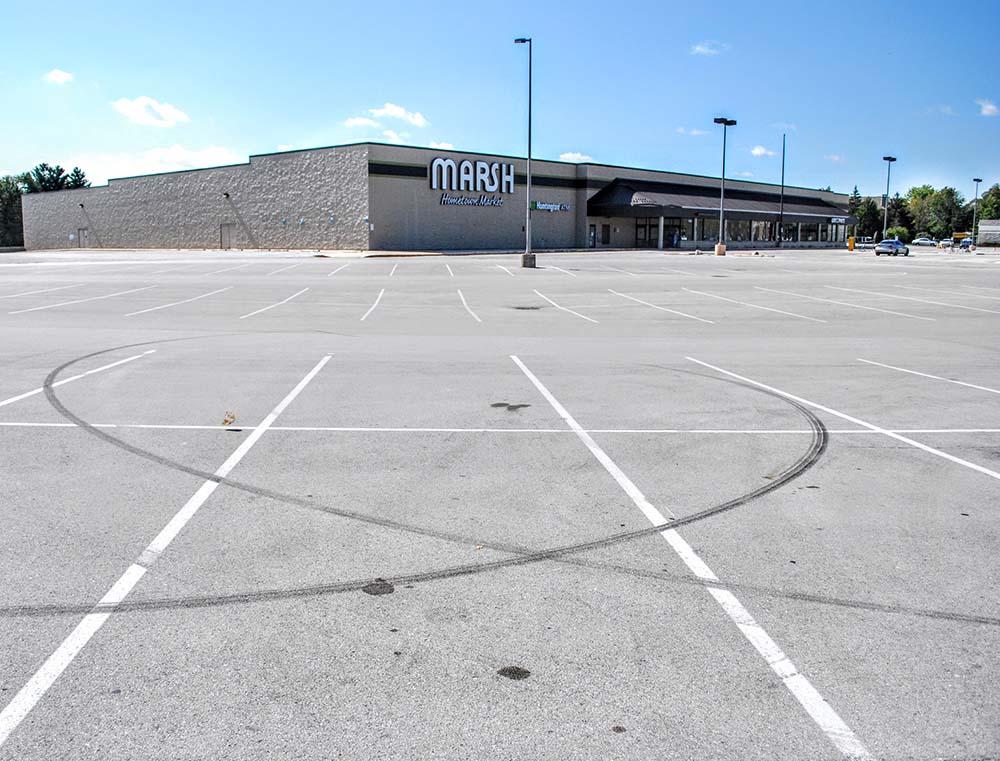
There are 208,000 people living in food deserts in Indianapolis. Importantly, 10,500 households without a car live in a “transit food desert,” with no grocery easily accessible by bus. The number of people in food deserts has risen by 10 percent since 2016, mostly driven by the closure of Marsh Supermarkets, one of Central Indiana’s major grocery chains. Despite the Marsh closings, there are actually more grocery stores in Indianapolis now than in 2016, but the existing stores tend to be grouped together and so offer access to fewer people than they once did.’
When it comes to food access, center city neighborhoods have fared better than townships and older suburbs. Two former Marsh locations downtown reopened under new ownership, and neighborhoods within four miles of Monument Circle actually have better food access today than in 2016. But for neighborhoods outside that four mile radius, the number of people in food deserts rose by 21 percent. Several Marsh locations in older suburbs either closed and were not reopened or reopened and closed again. This left many neighborhoods without a nearby grocery.
Black residents are more likely to live in food deserts than any other race or ethnicity in the county. People in poverty are fifty percent more likely to live in food deserts than people above the poverty threshold, and households without vehicles are also more likely to live in food deserts than households with vehicles. White and Latino residents have experienced the largest increase in the people living of food deserts since 2016.
When looking at food access by different transportation modes, access to healthy food changes drastically. Households with cars appeared to have access to grocery stores within a short drive almost everywhere in the county. Only 6,100 people lived farther than a 10 minute drive from a grocery store. On the other hand, food access was the worst for those households depending on bus transit or walking to purchase their groceries. Over 40 percent of Marion County lives in a pedestrian food desert, including over 60 percent of carless households. Also 236,000 people live in transit food deserts, including 10,500 households without cars.
Why are food deserts so important?
Food Deserts are part of the public health agenda because they relate to health outcomes. Certain diseases, like diabetes and obesity, are closely related to our dietary choices. Our dietary choices are, in turn, based on the type of food we are able to purchase.
Many factors affect what food we purchase, and one of them is access to healthy choices. Healthy foods are normally only available at grocery stores and supermarkets. If an area lacks a grocery, its residents will not have the availability of choosing healthy food options and may develop diet-based illnesses.18

Why Food Access Matters, How We Measure It, and What We Discovered
In July 2019, the City of Indianapolis allocated $730,000 to support various food assistance initiatives, including a Lyft Pilot Support program, Food Champions program, and mobile food markets.1
The Lyft Pilot Support program subsidizes riders to and from the grocery store for those living in areas with low food access. The current cost to participants is $1 (for trips with a normal cost up to $10) per ride and is available for residents of the Far Eastside to shop at one of the six designated grocery neighborhoods (Aldi, Kroger, Carniceria Guajanato, Tienda Morelos, Walmart, and A&I Variety Meats and Produce).2
The Food Champions program assists residents that are engaged in addressing food access in neighborhoods. The 10-week program provides participants with two-hour workshops about topics related to project management, grant writing, and food systems. Through the program, participants will work on developing their food access projects, and will receive a money award to sustain it.3
The purpose of all these programs is to alleviate food insecurity for those living in the city’s food deserts. The term “food desert” was first used in the 1990s in the United Kingdom to refer to low income areas that lacked an accessible and inexpensive food source.4, 5 Although the essence of the term “food desert” has remained consistent, there is no universal definition of what a food desert is. The federal government, for example, uses several definitions.
- The 2008 farm bill defined food deserts as areas “with limited access to affordable and nutritious food, particularly such an area composed of predominately lower income neighborhoods.”6
- Centers for Disease Control and Prevention defines them as “areas that lack access to affordable fruits, vegetables, whole grains, low-fat milk, and other foods that make up the full range of a healthy diet” usually found in impoverished areas.7
- The U.S. Department of Agriculture defines food deserts as areas with both low healthy food access and low income.8
These definitions share three core components: 1) they are used to classify areas or neighborhoods, 2) they consider access to nutritious food, and 3) they consider the socioeconomic status of neighborhood residents. However, they measure these elements differently.
The lack of a universal definition has led researchers to look at food store density,9, 10, 11 the diversity of food stores in study areas,12, 13 and resident accessibility for stores.12, 14 Regardless of the approach, however, most studies have highlighted a disparity in the number and type of food stores by race and income.15 Neighborhoods of color tend to have less access to healthy food outlets than primarily white neighborhoods with similar socio-demographic characteristics.13, 15
Food deserts have been found to contribute to diseases like diabetes and obesity because they can impact residents’ dietary choices. When residents do not have access to grocery stores that sell healthy food, they are more likely to buy food of poor nutritional value at convenience stores.15, 16 This less nutritious food increases the risk of obesity.16 Furthermore, people with diabetes find it difficult to “[tailor] their food selection to a diabetes regimen” if they do not have access to healthy food stores.17
How do we measure food deserts?
Food deserts are low-income neighborhoods with low-access to healthy food. In our definition, we use census block groups to define neighborhoods.
We consider low-income neighborhoods to have high poverty rates (at least 20 percent) or median household income significantly lower than the region’s (80 percent of the regional average).
Low-access neighborhoods have at least 200 people people or one third of the population farther than one mile from a grocery store.
Does Indianapolis Have Food Deserts?
To answer this question, we used the USDA’s definition of low food access and low income. This definition has broad awareness and acceptance because of its use in the USDA’s popular Food Access Research Atlas. The USDA uses census tracts to measure food deserts, but we base our measure on block groups because they are smaller and provide an accurate, high-resolution
picture of food access.
We identified low income areas as block groups with a poverty rate of 20 percent or greater, or with a median household income that is less than or equal to 80 percent of metropolitan area median income. These are the same criteria used by the USDA.
We defined low food access areas as block groups that have at least 200 people or 33 percent of people farther than one mile from a supermarket, supercenter, or large grocery store. These areas are based on the USDA’s census tract definition of food deserts but adjusted because block groups are smaller than tracts.
We begin our analysis in 2016 to examine the effect of Marsh’s closure. At that point, Marsh operated 10 percent of Marion County grocery stores and was the second largest chain in the county.
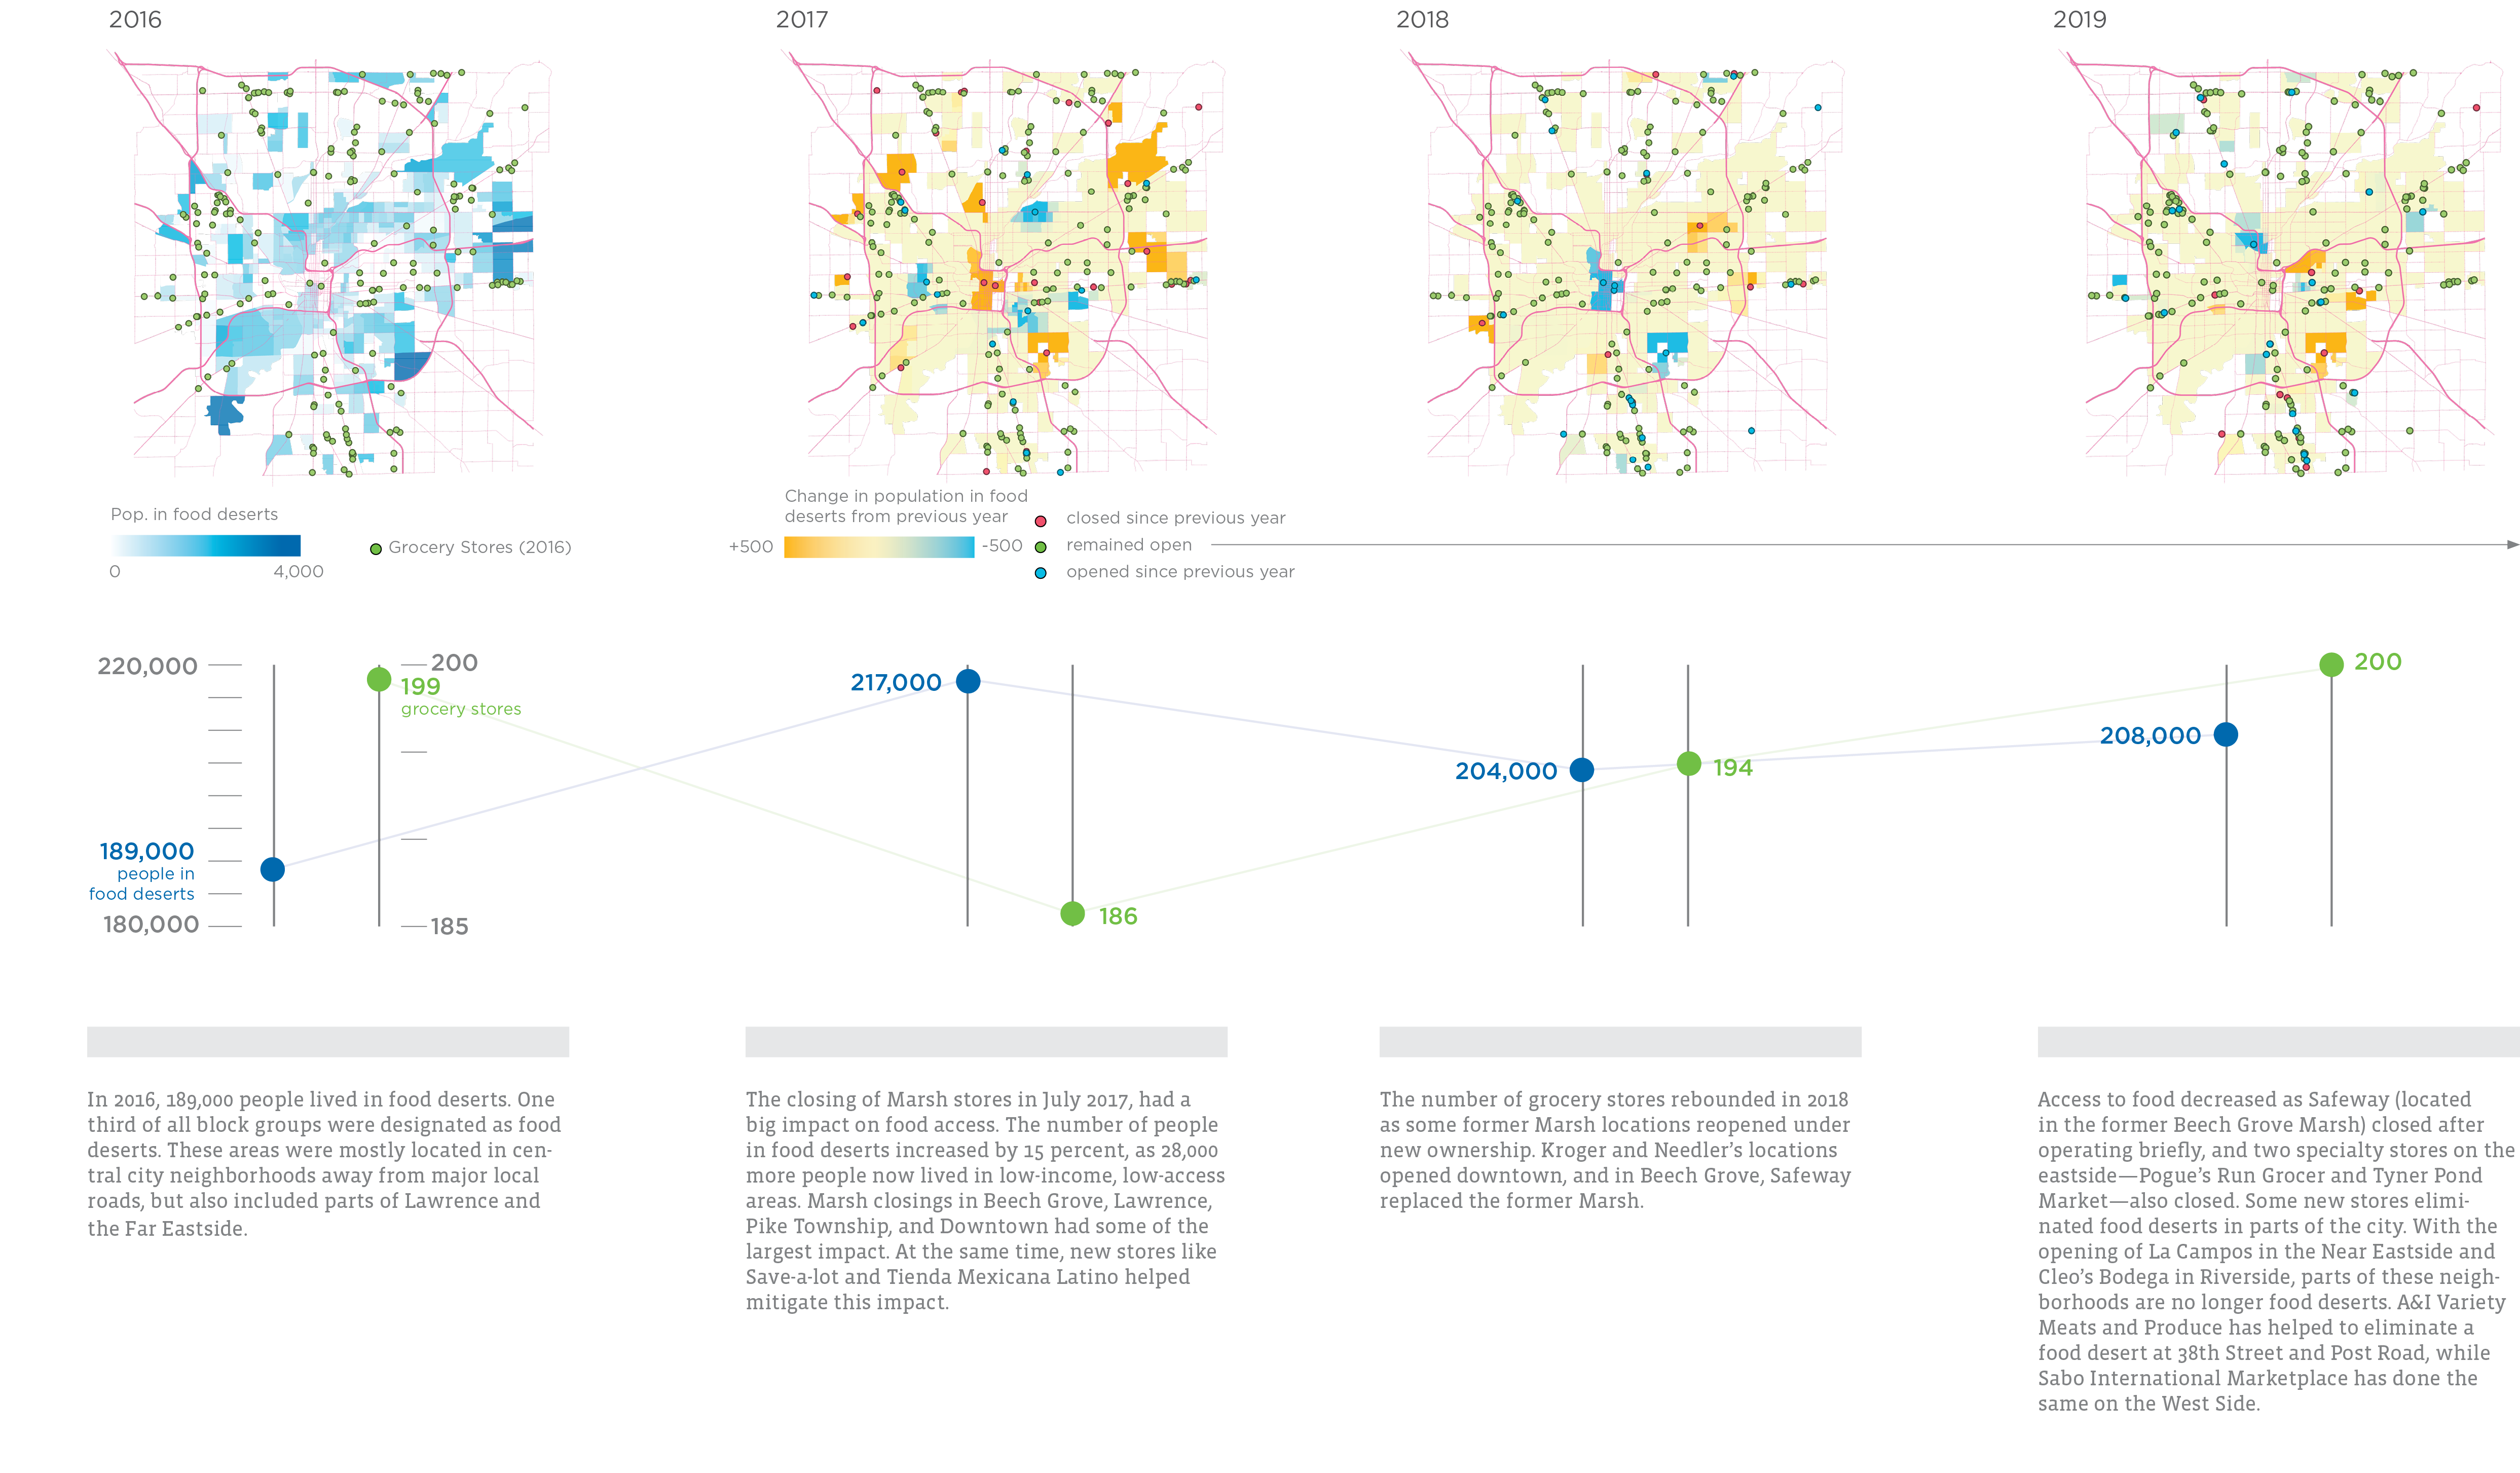
Food Access Through Time
Indianapolis Food Deserts in 2019
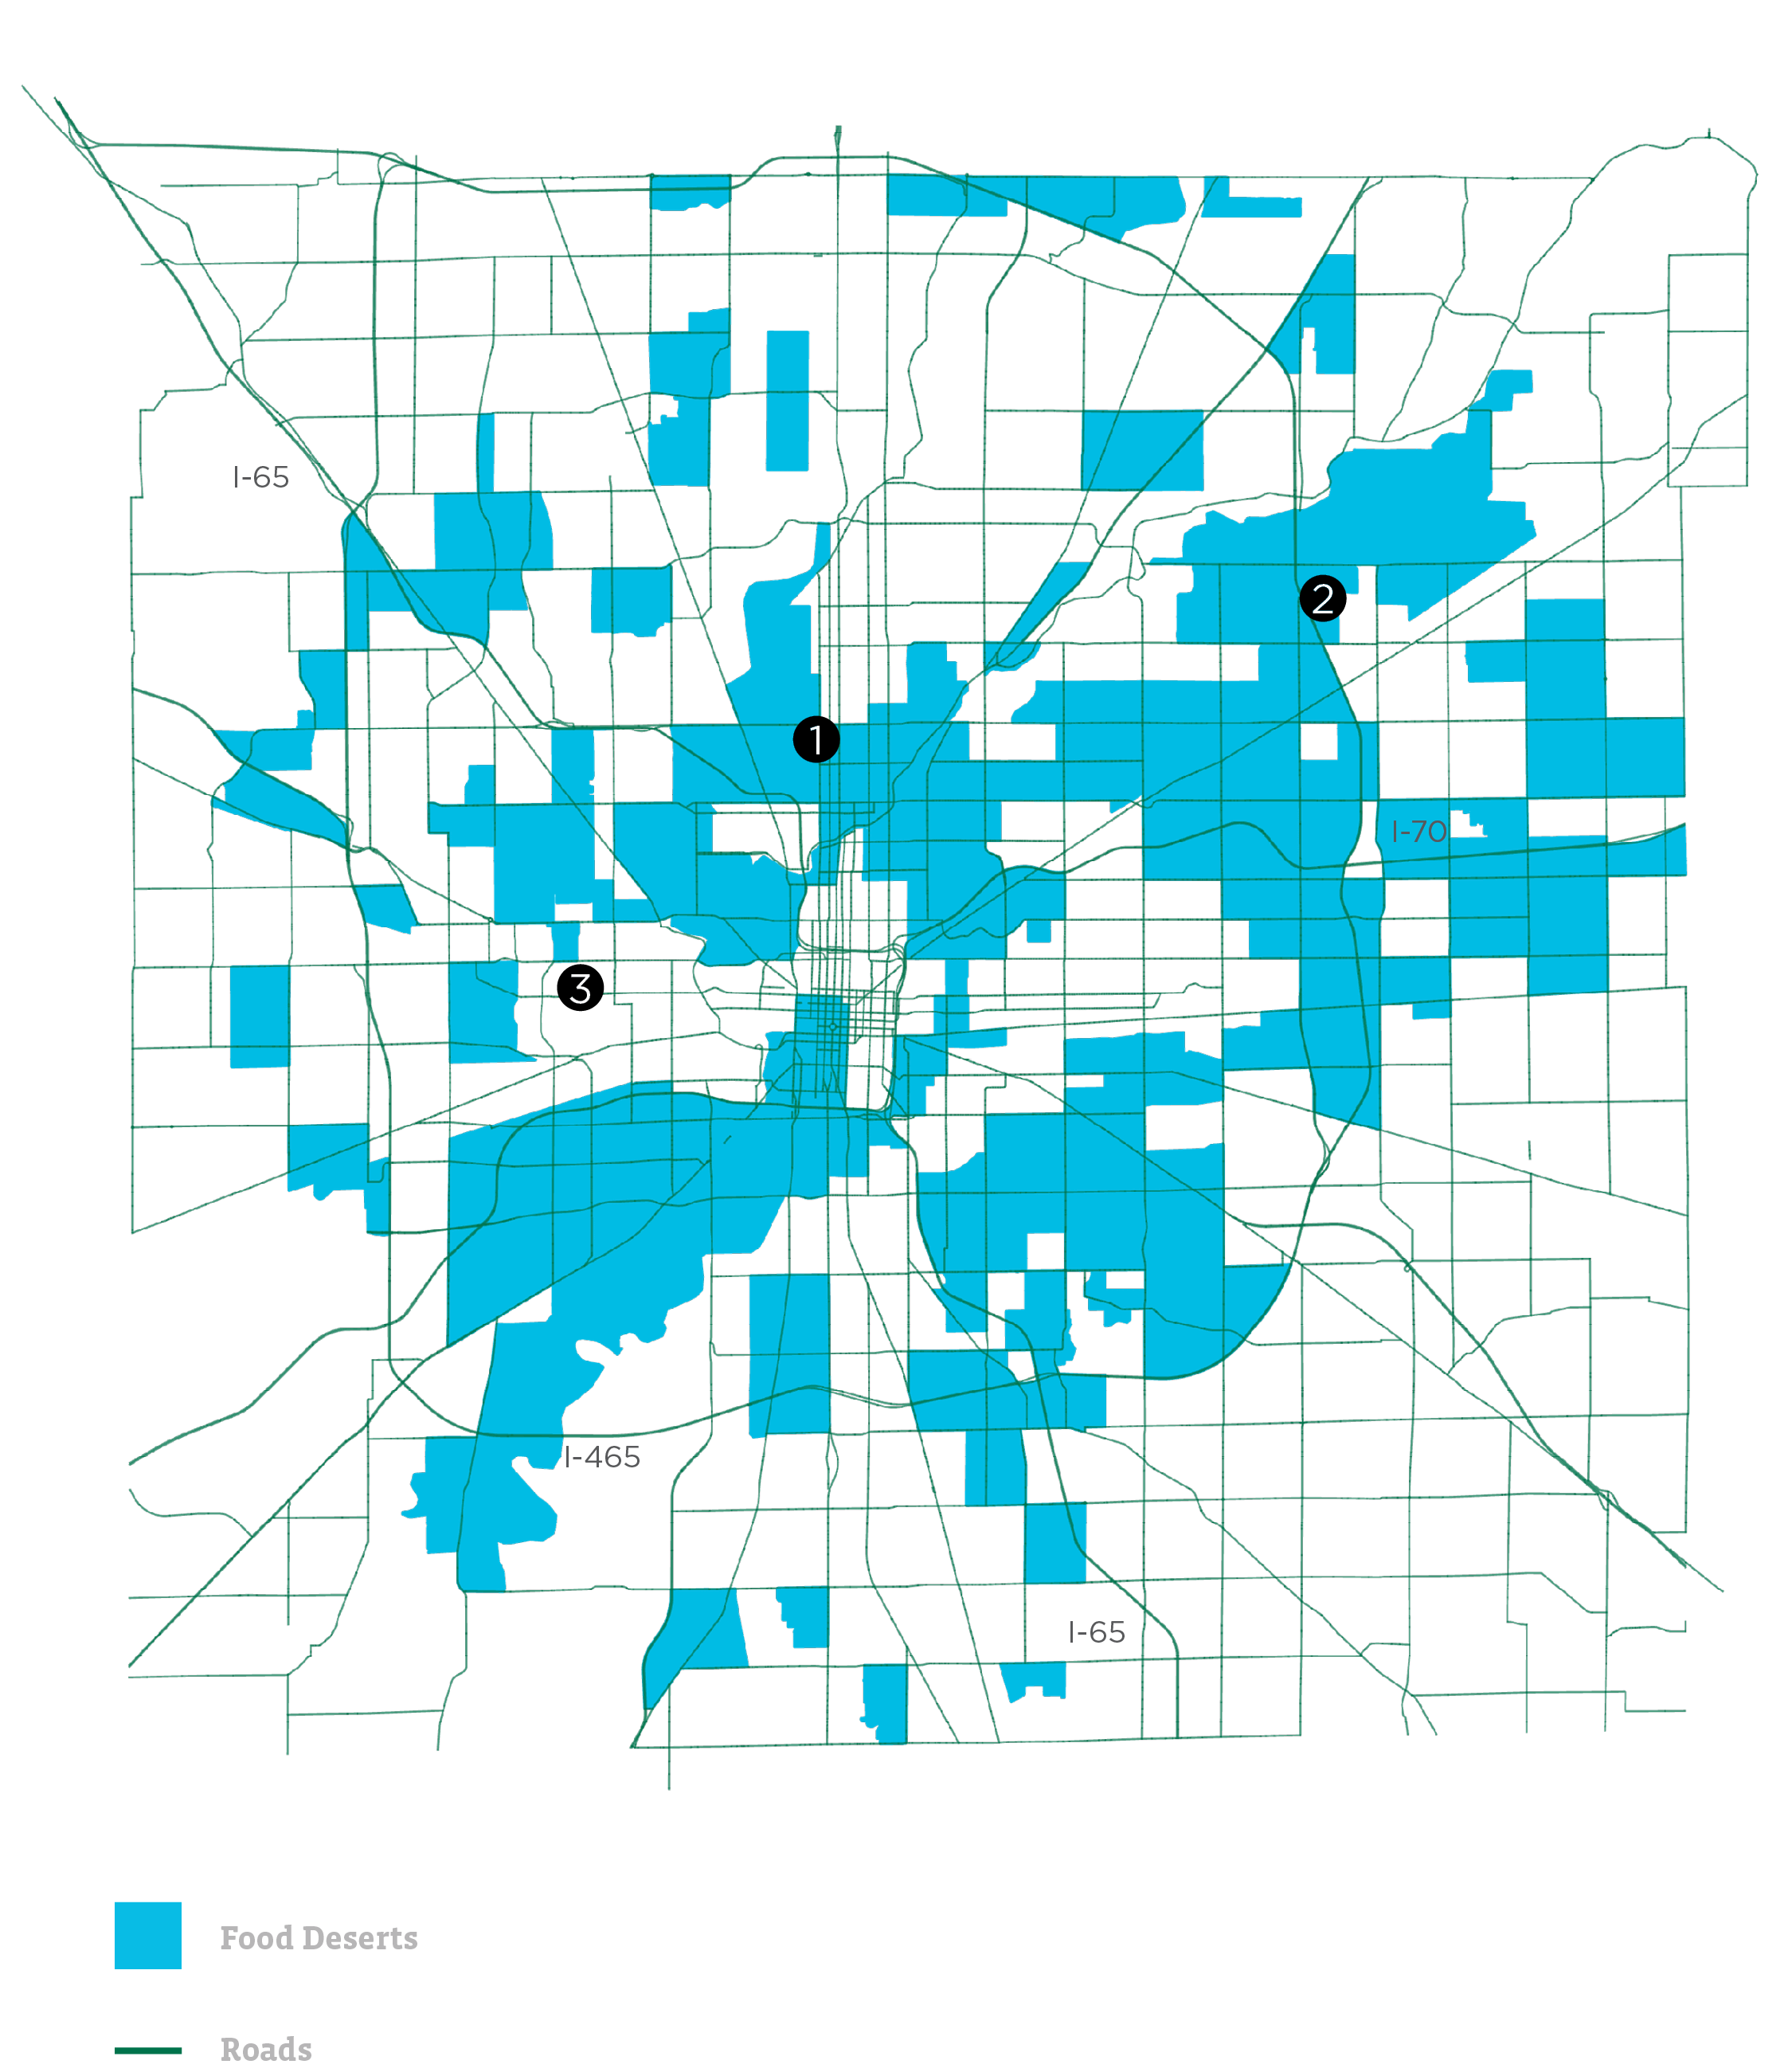

What Food Access Looks Like in Three Neighborhoods
FOOD DESERT
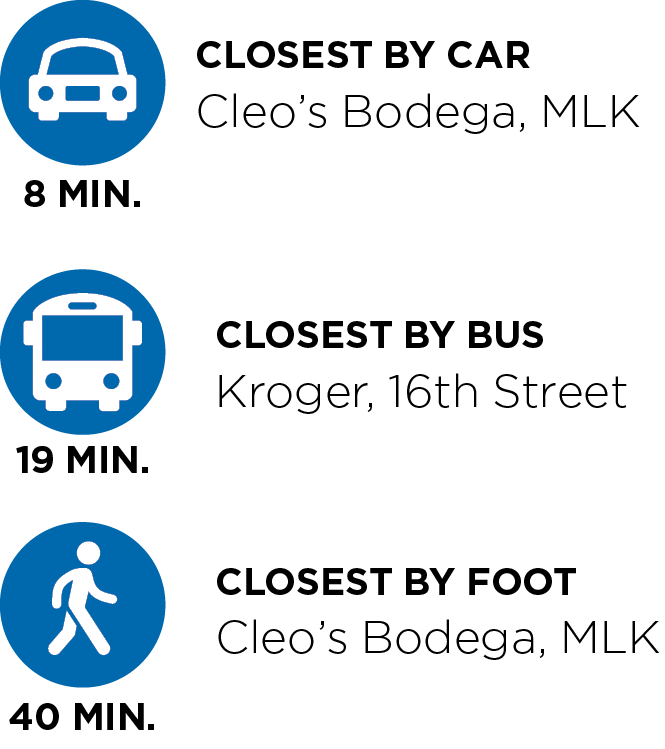
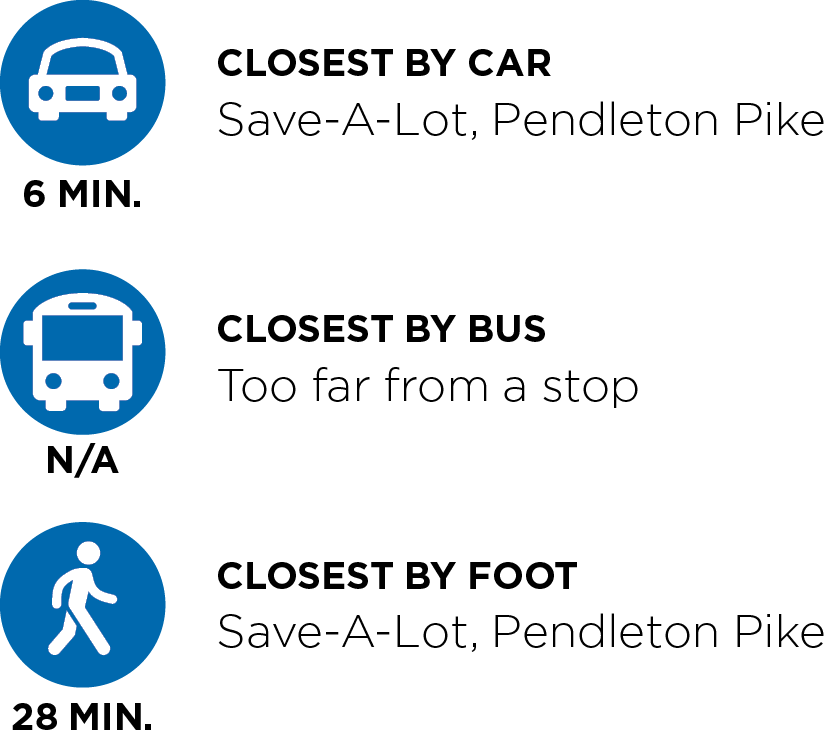
FOOD DESERT
Just south of Lawrence Central High School, this increasingly Latino block group had some issues with food access in 2016 (15 percent of the population was far from a grocery). But the issue is much worse after Marsh closed on Franklin Road. Now, 99 percent of residents are far from a grocery. Transit service does not improve this number. None of the 2,700 residents have access to the grocery via a 10 minute transit trip. The nearest groceries are on Pendleton Pike, which is an easy drive. However, the number of households without vehicles is growing quickly here, and the nearest bus stop with quick access to a grocery is a mile away.
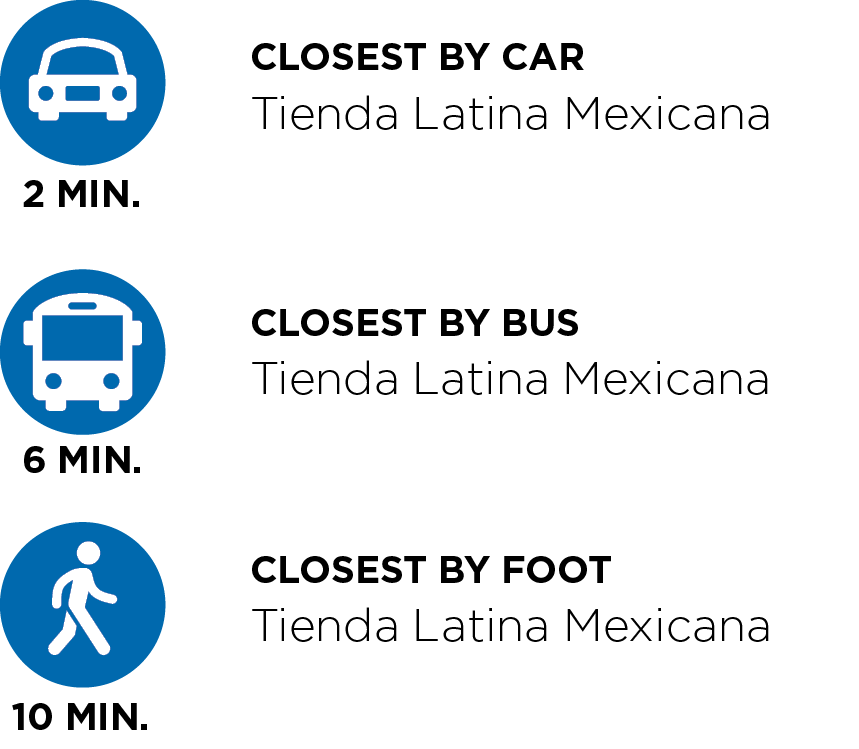
NOT FOOD DESERT
The block group northwest of Michigan Street and Tibbs Avenue was a food desert in 2016. Seventy percent of the neighborhood lived in a food desert. With the introduction of Tienda Latina Mexicana, this neighborhood now has close access to fresh food. This small store still carries a substantial selection of produce. Kroger at West Michigan and Holmes is accessible by transit in 10 minutes.
Food Access Has Worsened Since 2016
More than a fifth of Indianapolis—208,000 people, or 22 percent of the population—lives in a food desert. In 2016, 189,000 (20 percent) lived in food deserts.
Food access is worsening, but not because there are fewer groceries. While 37 stores have closed since 2016 (and have not been replaced with a new grocery), 40 new store locations have opened. As a result, there are about the same number of grocery stores now as in 2016. However, most new locations are near other groceries. All but three of the new locations were near an existing grocery (within its one-mile service area). Twelve of the 37 closures were far from another grocery, meaning they were the only stores serving their particular neighborhood.
The geographic concentration of grocery stores means that, even though the number is about the same, the total area served by them has fallen eight percent since 2016.
In the urban core, food access actually improved for many neighborhoods even as it worsened overall. Within four miles of Monument Circle, the number of residents in food deserts declined from 62,000 to 54,000. Outside this four-mile radius, people in food deserts rose from 127,000 to 154,000. This increase occurred as a ring of stores closed near Interstate 465, reducing food access on the far east and west sides of the city.
Food Access Tends to Be Worse for Vulnerable Populations
Food access tends to be worse for black residents and people in poverty. About one third of black residents in Indianapolis live in food deserts, and the same is true for people in poverty. Surprisingly, the population in food deserts increased the fastest since 2016 among whites, Latinos, and those above the poverty line.
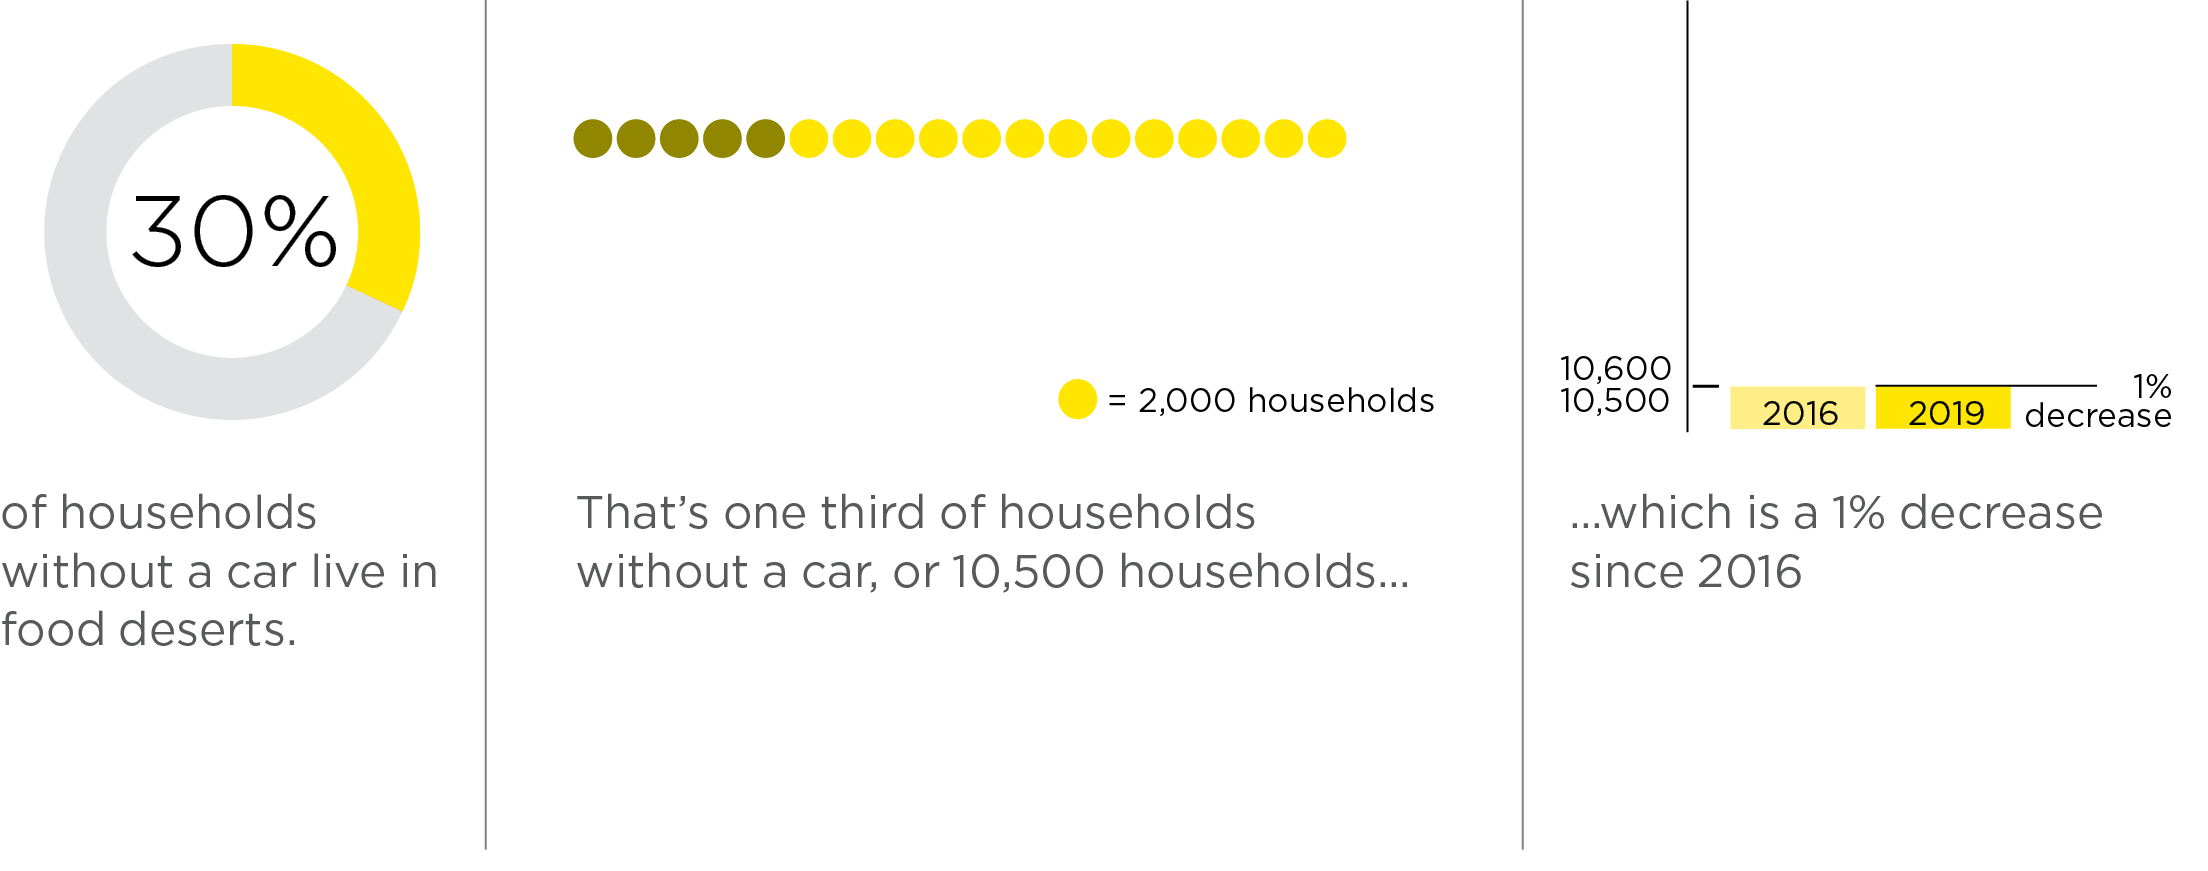
One third of households without cars live in a food desert. There are 10,500 households without vehicles in food deserts. Another 3,000 carless households are in areas with low access to groceries, but they are not considered food deserts (because they are not low-income neighborhoods or do not have enough sufficiently low food access). However, some of these households can access groceries conveniently by transit, even though they are farther than one mile from a store. Below, we define a method for designating “transit food deserts” and examine how many carless households have no bus access to a grocery.
Food Access by Demographic Group
White
Almost half of food desert residents are white, and this group has experienced a significant increase in the number of people living in food deserts.

Black
There are almost as many black residents in food deserts as white residents, but because the black population is smaller overall, they live in food deserts at a much higher rate than white residents.

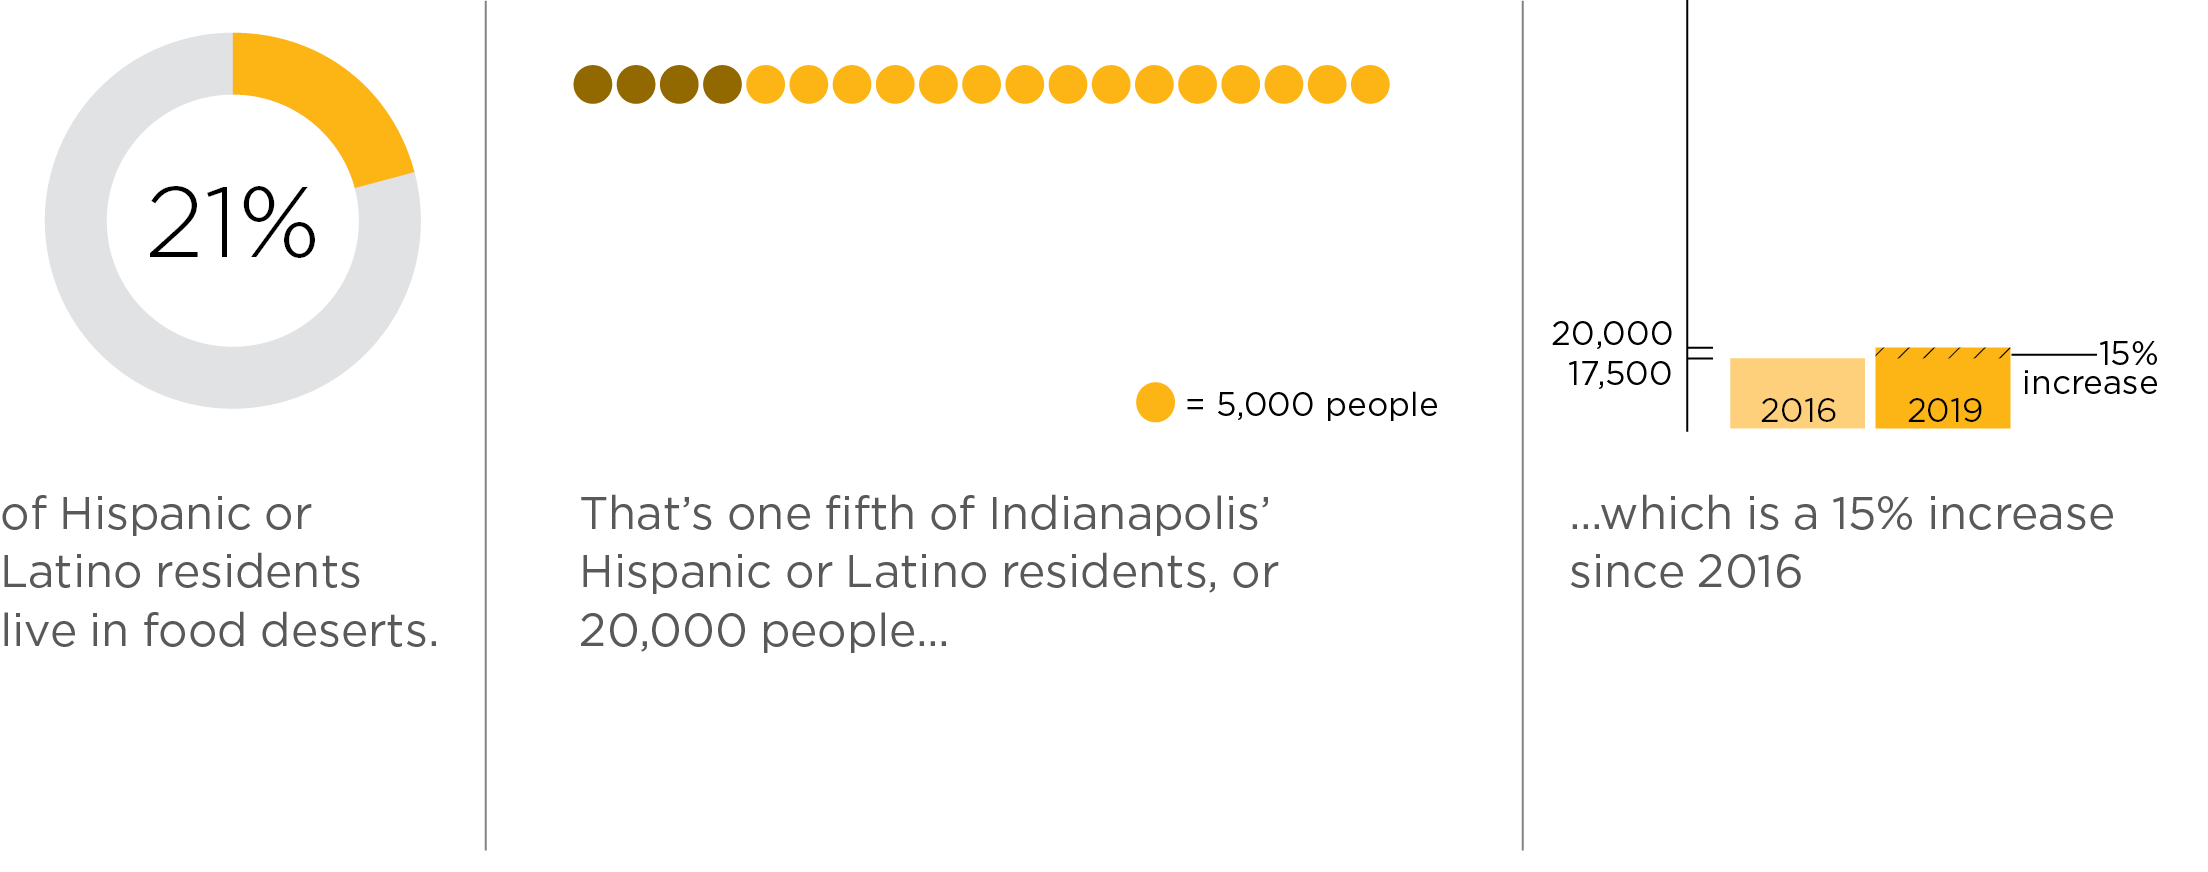
Hispanic or Latino
A growing number of Hispanic and Latino people live in food deserts as groceries in some Latino neighborhoods on the northwest side and northeast side closed.
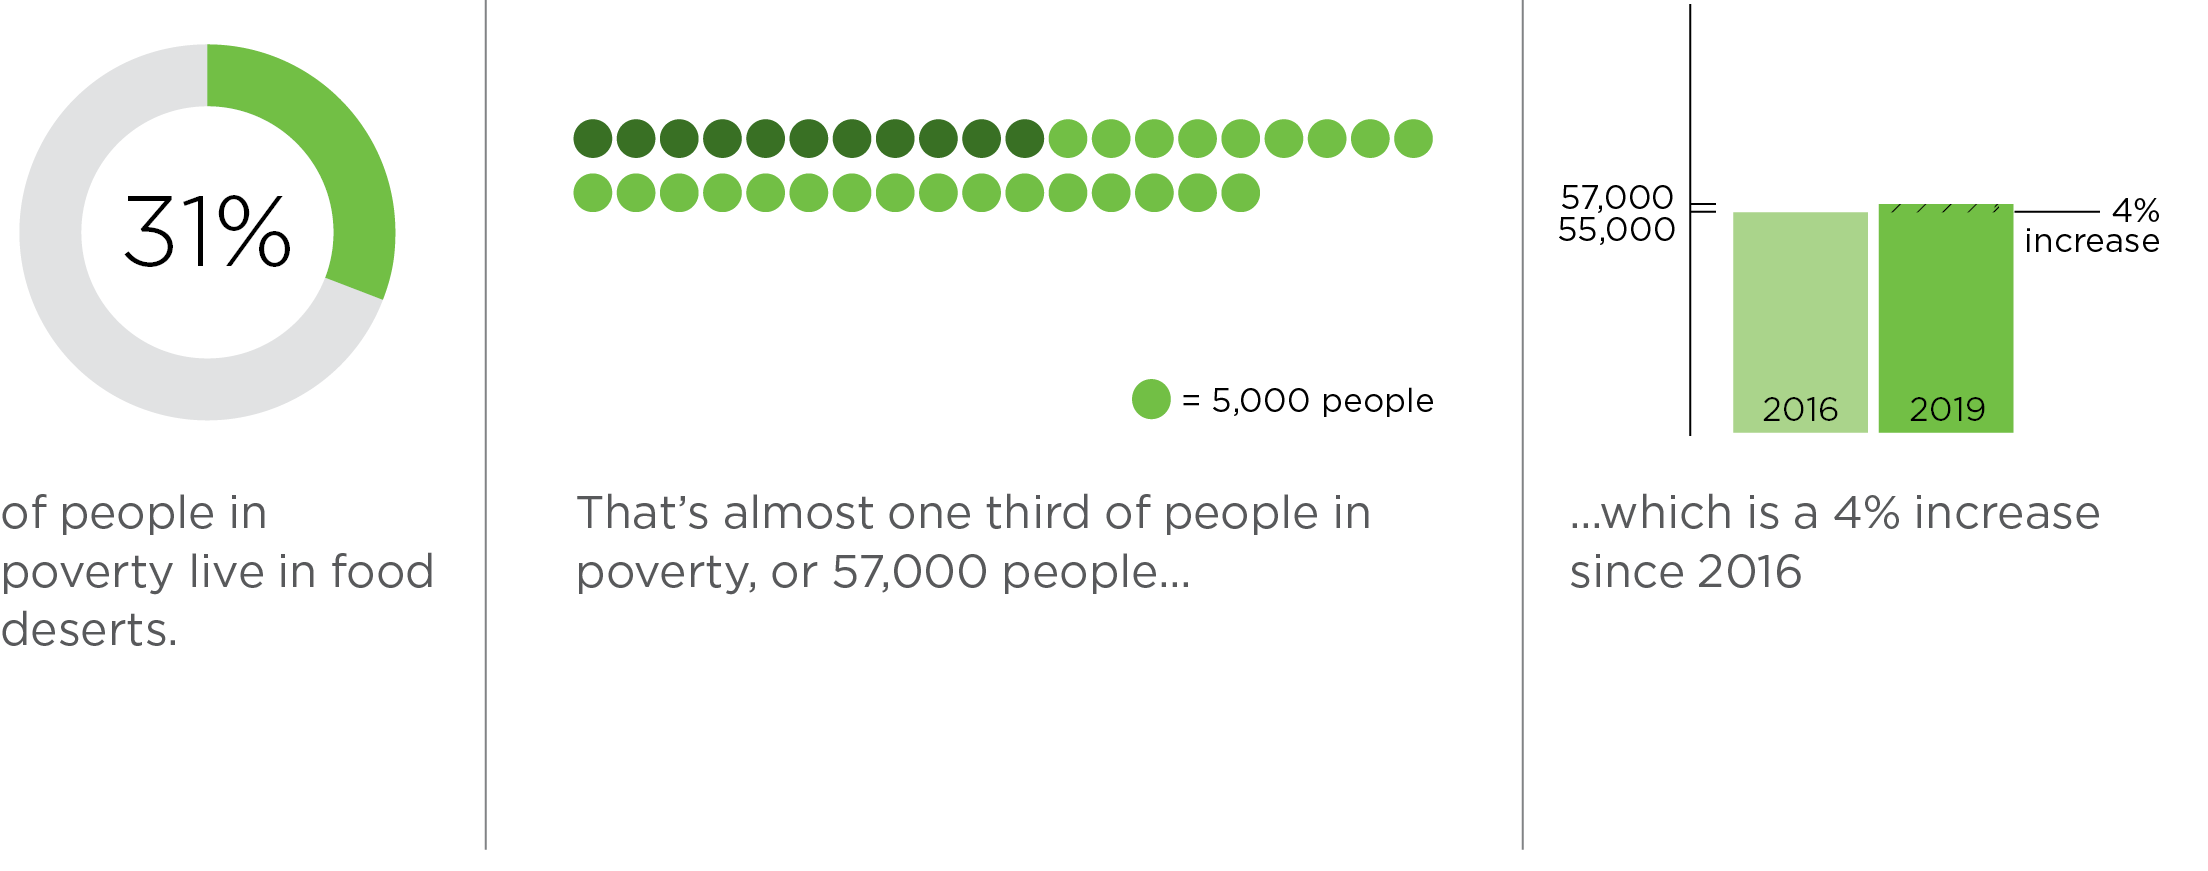
People in Poverty
This group faces a higher chance of living in a food desert than the overall population, but the decrease in food access has not hit them as hard.
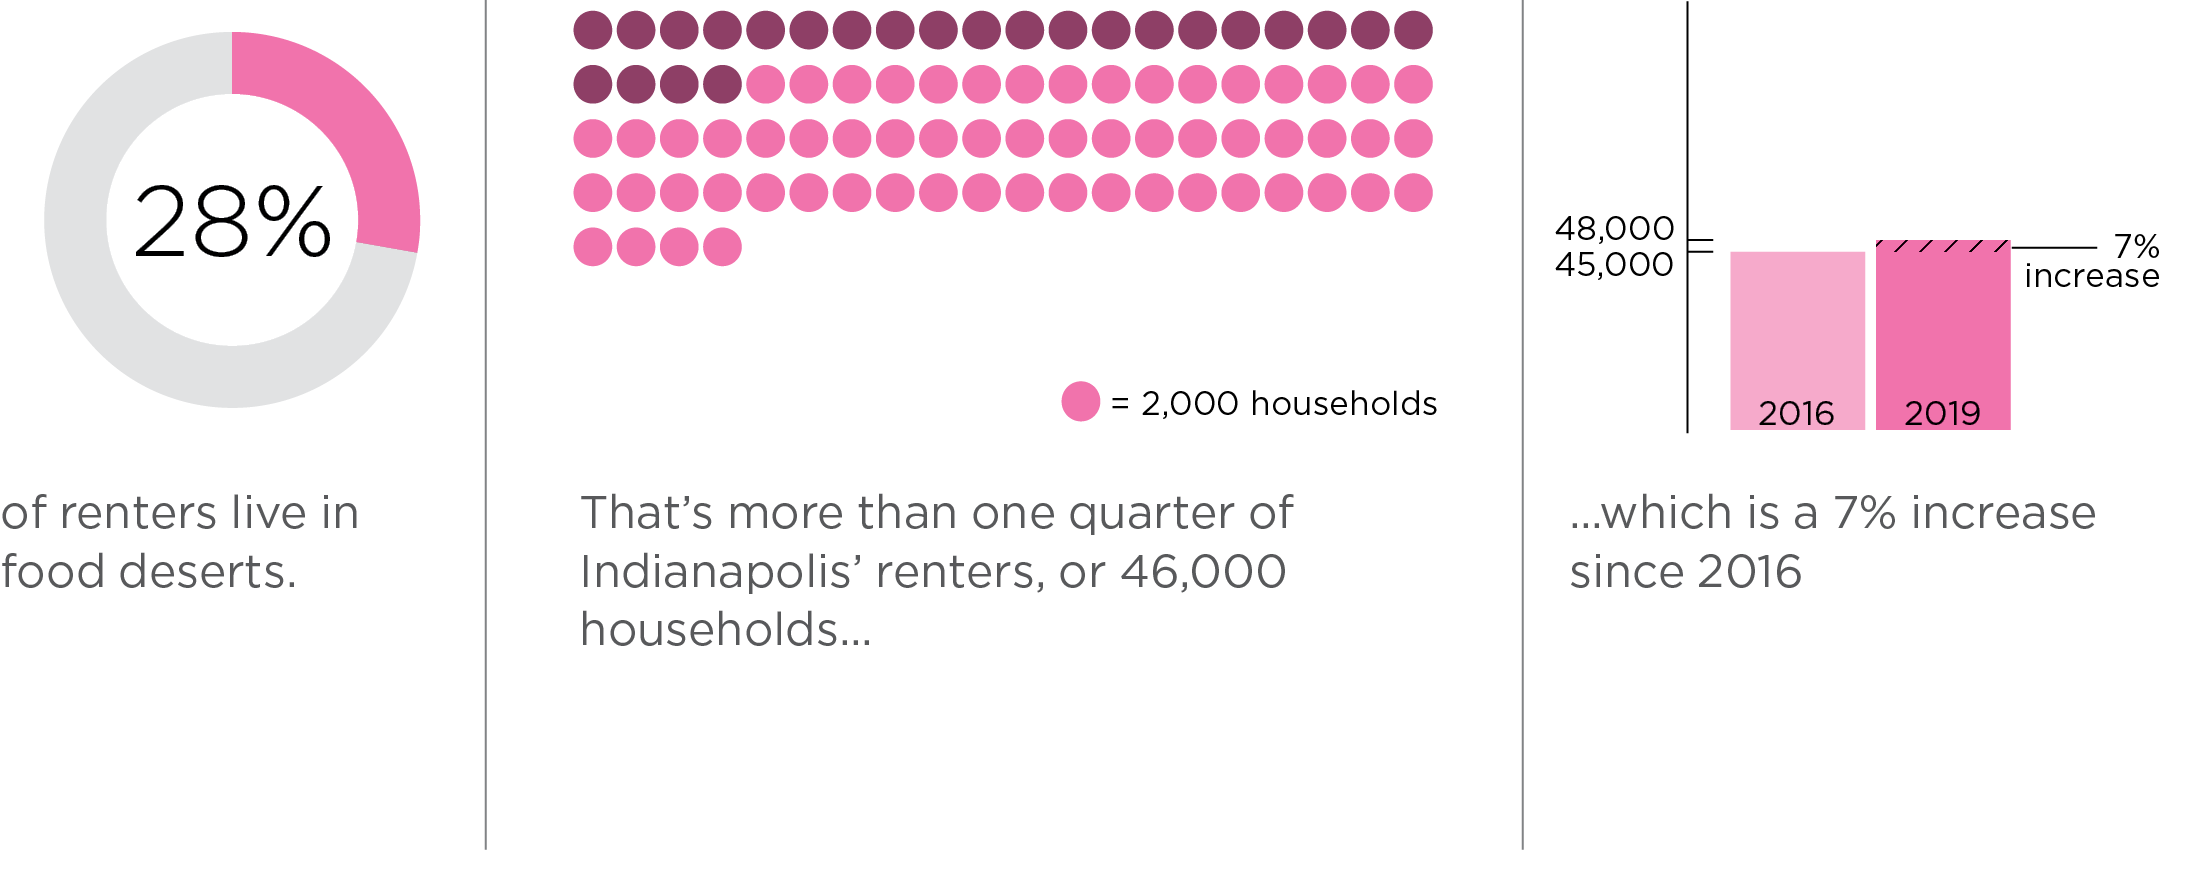
Renters
Renters are slightly more likely than average to live in a food desert. Renters also have lower incomes than homeowners, on average, and food deserts are, by definition, low-income neighborhoods.
Households without a Vehicle
This group is 32 percent more likely to live in a food desert than households overall. Their access actually improved since many of these households are in center city neighborhoods where food access increased.

How do we measure transit food deserts?
Bus service areas were calculated by creating a quarter mile network distance around grocery stores. Bus stops that intersected those service areas were identified as origin stops. A bus route travel distance of 2.33 miles was calculated from the origin stops. The 2.33 miles travel distance was chosen as the farthest distance people can travel in 10 minutes. This distance was calculated by multiplying the IndyGo basic service standard speed (14 MPH).21 Finally, a quarter mile network distance was created around every bus stop that intersected the areas that could be reach in 10 minutes.

Grocery Stores are Accessible by Car, but What About by Bus?
So far, we have measured access using a standard distance to a grocery store: one mile. This definition implies that a grocery more than a mile away is not very accessible. However, accessibility depends on what mode of transportation you use. Driving to a grocery store two miles away might take only a few minutes but walking to a grocery one mile away would mean carrying heavy grocery bags for 20 minutes. Getting to the grocery store on transit depends not only on the location of the store, but also on the location of bus routes and stops.
In order to understand this situation, we looked at food access by car, by bus, and on foot. We developed new food desert definitions for each of these transportation modes.
Auto Food Deserts
To identify the areas of town that would have access to grocery stores by car, we created service areas using a 10 minute drive during a weekday afternoon. There are only about 6,100 people that live farther than a 10 minute drive from a grocery. There are a few neighborhoods with low food access by car, mostly located on the southeast edge of the county. Since none of those areas are classified as low income, there were no areas identified as
auto food deserts.
Transit Food Deserts
While this broad access by car is encouraging, it must be noted that about 10 percent (35,000 thousand) of Indianapolis households do not own a vehicle. Furthermore, 16,000 additional households have limited vehicle availability, with fewer cars than working adults. These households would benefit from transit or pedestrian access to a grocery.
It should be a priority to address food access for households who have limited vehicle access and live where grocery stores are not accessible by transit. In order to locate this population, we defined “transit food deserts” by assuming a quarter mile walk from the origin and destination stops and traveling a distance equivalent to 10 minutes.
There are 236,000 people who live in transit food deserts including 10,500 households with no vehicle. The location of food deserts changes under this definition. Central city neighborhoods like Martindale Brightwood and Crown Hill are not transit food deserts, because transit service is relatively plentiful here. Older suburbs like Lafayette Square and Lawrence have some of the most accute problems with food access because grocery stores and transit are both lacking. Therefore, thousands of households without cars live in transit food deserts.
Under the standard food desert definition, black residents and people in poverty were two of the groups most likely to live in food deserts. These groups also make up a large part of transit ridership. While IndyGo ridership is diverse,19 the majority (55 percent) of bus riders in Indianapolis identify as black. Over half of riders (57 percent) earn less than $25,000 in annual household income. Shopping is a common reason IndyGo riders use transit. Ten percent of trips starting at home are made with the sole purpose of going to a shopping destination.20
When comparing transit food deserts to standard food deserts, black residents have marginally improved access. Instead of 82,000 people in food deserts, 75,000 black residents live in transit food deserts. People in poverty have worse access under this measure. Over 61,000 live in transit food deserts, compared to 57,000 using the standard definition. There was also an increase in the percentage of Hispanics and Latinos in food deserts (10 percentage points) using transit access.
In September 2019, IndyGo implemented three major system improvements. They opened the city’s first bus rapid transit line, increased frequency for some local routes, and extended service hours into early morning, late evening, and weekends. These changes should improve access to healthy foods. They allow riders to travel to grocery stores by bus on days they are not working and reduce wait times for busses.
Pedestrian Food Deserts
We identified pedestrian food access by assuming a half a mile walking distance from grocery stores. Unsurprisingly, most people do not live within a half mile of a grocery store. 768,000 people are outside this range. Over 40 percent of Marion County lives in a pedestrian food desert.
Having a grocery store within walking distance would be a boon to a household without a car, but Marion County does not have sufficient population density to make this a reality. It is more efficient to supply bus service, expanding access to stores that are centrally located on main roads.
Discussion and Conclusion
Market Trends
On May 11th, 2017, Marsh Supermarkets, one of Central Indiana’s major grocery chains, filed for Chapter 11 Bankruptcy. According to bankruptcy documents, Marsh was hurt by the expansion of competing chains and by high cost leases. Chains like Kroger and Meijer invested six times more capital than Marsh to build and renovate stores. When stores with similar prices and quality of produce are near each other, capital improvements (such as store renovations) and technological advancements (such as self-checkout) are necessary to attract customers. New Meijer and Kroger store openings and renovations resulted in the decline of Marsh sales. Some locations experienced a double-digit decline in sales.22
In 2016, Marsh attempted to negotiate reduced lease costs, but those conversations did not yield any cost savings. In some of their stores, such as a downtown location on New Jersey Street, Marsh agreed to pay their rent based on a percentage of their profits, which resulted in them paying a lease rate above market price.23
The Marsh closures came as grocery stores were expanding nationally. Total grocery square footage increased 29 percent in 2018, according to real estate analysts at Jones Lang LaSalle.24
Nationally, some grocery chains are experimenting with smaller stores. Meijer opened Bridge Street Market, which Jones Lang LaSalle says “operates at about 37,000 square feet, significantly smaller than a typical 200,000-square-foot Meijer store.” Amazon Go opened 10 locations at 2,000 square feet, and GreenWise Markets, run by Publix, are about 29,000 square feet. Locally, Walmart has introduced a small neighborhood format, but one of these closed near Lawrence in 2019, inspiring debate about food access.
A smaller footprint may mean lower costs, allowing retailers to survive in smaller markets and fill gaps in food access. However, one retailer that attempts to fill those gaps is seen as a barrier to food access by some cities. According to the Institute for Local Self-Reliance, Dollar General and Dollar Tree “are opening stores at such a density that they’re crowding out full-service grocery stores.”25 Cities including Birmingham, Tulsa, Kansas City, and Oklahoma City have implemented zoning policies to restrict new dollar store development in areas with an already high density of stores.26
Discounters, including dollar stores, are expected to grow faster than supermarkets, according to grocery research firm IGD.27 However, IGD also expects discounters to expand their fresh food offerings, which could have a big impact on low-income neighborhoods if it occurred. Analysts at Nuveen Real Estate connect growth in the discount market to rising inequality. As the middle class shrinks, they predict growth in both discount and boutique groceries.
State and Local Legislation
The departure of Marsh left a significant void in certain areas of the community, accentuating the food access issues in the county and Central Indiana. Since 2016, state representative Robin Shackleford has tried to pass legislation to establish a healthy food financing program. This program, housed under the Indiana Housing & Community Development Authority, would provide funding in the form of grants or loans to projects that increase the access to healthy food. However, despite receiving bipartisan support and sponsoring, the bill has never made it out of the House Committee on Ways and Means.
The lack of action by the state legislatures has led to the establishment of programs at local government level. In Marion County, the city-county council allocated $730,000 to the Office of Public Health and Safety to support various food assistance initiatives. These include the Lyft pilot Support Program, the Food Champions Programs, and Mobile Food Markets.
Online Delivery
With the increasing popularity of online shopping, most grocery chains have opted to establish an online shopping market that allows customers to purchase products online and either pick them up at the store or have them delivered. This delivery option is not only convenient, but it can also improve food access for households living in food deserts. However, services like Instacart charge delivery fees, and government benefits cannot be used to buy groceries online. This can deter low income households from using these services.
Some federal legislators recognized the potential of online delivery to improve food access, and added a section to the 2014 farm bill that mandated the creation of a pilot program “to test the feasibility and implications of allowing retail food stores to accept Supplemental Nutrition Assistance Program (SNAP) benefits
through online transactions.”28
The pilot program was officially launched by the USDA Food and Nutrition Service in the State of New York on April 2019. This program allows SNAP Electronic Benefits Transfer (EBT) card holders to purchase groceries online with their EBT card at three online retailers (Walmart, ShopRite, Amazon), although participants will still be require to pay for service and delivery fees with their own money. This pilot program is expected to be expanded to another seven states in the near future.
While this program is a great advancement, it does not reduce one of the major barriers to online grocery shopping for low income residents: the service and delivery fees. These fees in some instances can be as high as $9.95 per trip.
Future Research Questions
There are a variety of food access measures, from travel distance and travel time to groceries to density of grocery stores in neighborhoods. However, most of these food access measures focus on a single access point to groceries, mainly people’s residence. But not all grocery trips originate at home. People can purchase groceries near work, on their path home, or at other locations. A measure that uses multiple access points, such as work and home locations, should be developed to provide a “commuting” food access understanding.
For this report we used residential property parcels as the unit of analysis and assumed an equal distribution of overall population and demographic characteristics among all parcels in a block group. However, people are not equally distributed among all parcels. For example, multi-family rental parcels are home to more households than single-family parcels. Furthermore, the demographics of each parcel could vary. In the future, we could improve the current measure by using the property classification codes and assessor data to better identifying the type of residential parcels and the type of households that live in them. We could use American Community Survey data to model the demographics of different household types and apply those to parcels.
Find more interactive content from our series on food access.
How long does it take to get to a grocery in each neighborhood?
This past November, we released the report Getting Groceries: Food Access Across Groups, Neighborhoods, and Time. Expanding on this report, we created an interactive map to display food access information for each block group in Marion County. Click on a block group to ...
Estimated 200,000 Indy Residents Live in Food Deserts
Using recent, local data to improve on food access measures, we find that an estimated 200,000 Indianapolis residents have low food access and live in low income areas.
City Funds Flanner House Micro-Grocery in Food Desert
WFYI reports that the City of Indianapolis announced the first recipient of its Healthy Food Access grant on Thursday. Flanner House will receive $400,000 to develop Cleo's Bodega, a micro-grocery that will sell discounted food through a relationship with Under the ...
Who Has Access to Groceries and Farmers’ Markets?
The USDA defines food deserts as a census tract where “at least 500 people and/or at least 33 percent of the census tract's population reside more than one mile from a supermarket or large grocery store." [usda.gov] This is a useful definition, but of course food ...
A Model to Mitigate Hunger
By Sharon Kandris It’s clear that hunger and food insecurity are growing problems in Central Indiana. We’ve recently partnered with two Central Indiana organizations (Northside Mission Ministry of Second Presbyterian Church and United Way of Central Indiana) ...
Addressing Hunger in Central Indiana: Gaps and Opportunities
As you’re probably aware from recent news reports, Feeding America recently released its annual Map the Meal Gap report, with statistics on the state of hunger across the nation. According to its report, food insecurity (not always knowing where your next meal will come ...
Filling the Gap: Faith-based organizations are an important resource
At a time when families are experiencing more economic hardship and the need for services is increasing, nonprofits are continually forced to do more with less funding, fewer staff, and fewer resources. As reported in The Nonprofit Times, there were 10,000 fewer registered ...
Methodology
As we compared food access over time, the number of grocery stores was the only variable that changed. Demographic data was held constant based on 2013-2017 averages.
Data Sources
- Grocery Stores (2016-2019 – Marion County Public Health Department via SAVI
- Residential Parcels (2019) – Indiana Geographic Information Office
- Street Centerlines (2019) – IndyGIS
- Bus Routes & Stops (September 2019) – IndyGo
- Demographic Information (2017) American Community Survey 5-year Estimates
Methodological Overview
- We geolocated grocery stores, or used their address to find point locations.
- We created service areas around groceries based on the definitions below.
- We selected residential parcels that intersected service areas and identified these as having access to food stores.
- We aggregated all parcels to block groups, both this with access and those
without access. - We calculated the percent of parcels with access for each block group.
- We multiplied these percentages by the total population in each block group to identify the number of people without access.
- We used the number of people and percentage of parcels without access to identify low food access areas.
- If an area was identified as low income and low access, we noted it as a food desert.
- We calculated the number of people in food deserts by multiplying the population living in a food desert block group by the percentage of parcels without access to grocery stores. In other words, if someone lives in a food desert block group and are far from a grocery, they are considered to live in a food desert. If they live in a food desert block group but do not live far from a grocery, they are not considered to live in a food desert.
Service Area Definitions
- Standard Service Areas. These areas were created applying a one mile network distance from grocery stores. The street network was developed by the Polis Center using Marion County Street Centerlines.
- Car Service Areas. These areas were developed assuming a 10 minute drive away from a grocery store location. Traffic estimates were based on Monday at 6:00 p.m. Street network and traffic data was sourced from the HERE Q3 2019 data release through Esri ArcGIS Online.
- Bus Service Areas. These areas were developed using a quarter mile network distance around grocery stores. Bus stops that intersected those service areas were identified as origin stops. A bus route travel distance of 2.33 miles was calculated from the origin stops, based on the distance traveled in 10 minute at 14 miles per hour. Finally, a quarter mile network distance was created around every bus stop that intersected the areas that could be reached in 10 minutes and added to the initial quarter miles travel from grocery stores.
- Walking Service areas. These areas were created by applying a half mile network distance from grocery stores.
End Notes
- Indianapolis, Indiana, Fiscal Ordinance No. 13, 2019.BACK ▲
- Lyft, Inc. “Access to Healthy Food in Indianapolis – Lyft Grocery Access.” Lyft. Accessed November 13, 2019. ▲
- City of Indianapolis. “Neighborhood Food Champion Application.” indy.gov. Accessed November 13, 2019.▲
- Cummins, Steven, and Sally Macintyre. “A Systematic Study of an Urban Foodscape: The Price and Availability of Food in Greater Glasgow.” Urban Studies 39, no. 11 (2002): 2115–30. ▲
- Wrigley, Neil. “Food Deserts in British Cities: Policy Context and Research Priorities.” Urban Studies 39, no. 11 (2002): 2029–40. ▲
- U.S. Congress, House, Food, Conservation, and Energy Act of 2008, HR 6124, 110th Cong., 2nd sess., introduced in House May 22, 2007 There is also a neighborhood history at The Polis Center’s Project on Religion and Urban Culture. ▲
- “A Look Inside Food Deserts.” Centers for Disease Control and Prevention, August 21, 2017. ▲
- “Food Access Research Atlas: Documentation.” United States Department of Agriculture Economic Research Service. ▲
- Laraia, B. et al. “Proximity of Supermarkets Is Positively Associated with Diet Quality Index for Pregnancy.” Preventive Medicine, 2004. ▲
- Moore, Latetia V., Ana V. Diez Roux, and Shannon Brines. “Comparing Perception-Based and Geographic Information System (GIS)-Based Characterizations of the Local Food Environment.” Journal of Urban Health 85, no. 2 (February 5, 2008): 206–16.▲
- Odwyer, Lisel A., and John Coveney. “Scoping Supermarket Availability and Accessibility by Socio-Economic Status in Adelaide.” Health Promotion Journal of Australia 17, no. 3 (December 2006): 240–46.▲
- Raja, Samina, Changxing Ma, and Pavan Yadav. “Beyond Food Deserts: Measuring and Mapping Racial Disparities in Neighborhood Food Environments.” Journal of Planning Education and Research 27, no. 4 (June 2008): 469–82. ▲
- Moore, Latetia V., and Ana V. Diez Roux. “Associations of Neighborhood Characteristics With the Location and Type of Food Stores.” American Journal of Public Health 96, no. 2 (February 2006): 325–31.▲
- Larsen, Kristian, and Jason Gilliland. “Mapping the Evolution of Food Deserts in a Canadian City: Supermarket Accessibility in London, Ontario, 1961–2005.” International Journal of Health Geographics 7, no. 1 (April 18, 2008): 16. ▲
- Walker, Renee E., Christopher R. Keane, and Jessica G. Burke. “Disparities and Access to Healthy Food in the United States: A Review of Food Deserts Literature.” Health & Place 16, no. 5 (April 21, 2010): 876–84. ▲
- Drewnowski, Adam, and Se Specter. “Poverty and Obesity: the Role of Energy Density and Energy Costs.” The American Journal of Clinical Nutrition 79, no. 1 (January 2004): 6–16.▲
- Gucciardi, Enza, Mandana Vahabi, Nicole Norris, John Paul Del Monte, and Cecile Farnum. “The Intersection between Food Insecurity and Diabetes: A Review.” Current Nutrition Reports 3, no. 4 (October 2, 2014): 324–32.▲
- Morland, Kimberly, “Introduction,” in Local Food Environments: Food Access in America, ed. Kimberly Morland (Boca Raton, FL: CRC Press, 2015), 3-28.▲
- Davila, Kelly, Matt Nowlin, Unai Miguel Andres, and Deb Hollon. “Who Rides the Bus: Examining Transit Ridership in Marion County.” SAVI, September 15, 2017. ▲
- Lochmueller Group, and ETC Institute. “IndyGo On-Board Transit Survey Final Report,” 2017.
▲ - IndyGo. “Service Standards,” 2018.▲
- Marsh Supermarkets Holdings, LLC. Chapt. 11 Bankruptcy, Case 17-11066, Doc. 14 (Bankr. D. Del. 2017)▲
- McKinney, Matt. “Why Did Marsh Die?” WRTV, June 30, 2017. ▲
- JLL. “Grocery Store Tracker 2019”: Jones Lang Lasalle IP, Inc, 2019.▲
- Donahue, Marie. “Dollar Store Restrictions.” Institute for Local Self-Reliance, 2018.▲
- Donahue, Marie, and Stacy Mitchell. “Dollar Stores Are Targeting Struggling Urban Neighborhoods and Small Towns. One Community Is Showing How to Fight Back.” Institute for Local Self-Reliance, September 26, 2019. ▲
- “IGD: New US Grocery Forecasts Reveal $20bn Online Growth Opportunity.” IGD, October 5, 2017.▲
- “Supplemental Nutrition Assistance Program: Online Purchasing Pilot.” USDA, June 27, 2019.▲

