The effects of eviction can be significant and long-lasting, resulting in the personal loss of possessions, neighborhood community, and children’s schools, while increasing childhood trauma, negative health outcomes, and stress.
Even an eviction filing that does not result in an eviction can hurt a tenant’s prospects for finding a new apartment. The mark of a “scarlet E” on a tenant’s record can reduce their access to housing for years. Filings are in the public record, and to a landlord, an eviction filing can be a red flag. They may never look deep enough into the court records to understand the cause of the filing or the result of the case.
Evictions are not tracked by any national reporting system and no major federal programs exist to specifically divert people away from being evicted. Each year, Indianapolis ranks among the highest cities in the country in total number of filings, trailing only New York and Detroit pre-pandemic. Indiana’s affordable housing prices and landlord friendly policies have made it an attractive place for large multifamily investors, and these companies file evictions at a startlingly high rate.
Substantial fluctuations in eviction policies and assistance programs during the pandemic have shaken up the landscape of eviction nationwide. Strong safety nets put in place during the pandemic reduced evictions dramatically in 2020 and somewhat in 2021. As these are being gradually dismantled, there is uncertainty how this will affect evictions.
This article examines six months of eviction data in Marion County from January 1, 2022 to June 30, 2022 in the midst of these changes to establish a post-pandemic baseline. We then use these data to discover who are responsible for these evictions, how many people face multiple evictions in the same six-month period, and how evictions relate to health department violations.
We find that 65 percent of eviction filings are from large multifamily developments, though only 14 percent of rental households live in these properties. One tenth of people with evictions in six months (1,300) are filed against multiple times, accounting for one fifth of all filings. The worst offenders of health department complaints and violations file evictions at the highest rate.

More resources
This research was presented at Data and Drafts in partnership with WFYI and Indianapolis Public Library. Download the presentation slides.
View this article’s interactive maps as standalone web-apps:
Fluctuating Policies
Until two major federal interventions during the COVID-19 pandemic in 2020, there existed no national program to provide rental assistance or protections to vulnerable households facing eviction. Since the failures of large federal public housing developments in the 1950s and 1960s, the federal government has steadily reduced its investment in nationalized housing programs. Those that have persisted focus on providing incentives and subsidies to developers to encourage affordable housing construction, or providing vouchers to low-income tenants to find their own housing. Until 2020, no program had focused on providing an eviction safety net.
The March 2020 CARES Act’s federal eviction moratorium and the National Eviction Moratorium issued by the CDC in September 2020 protected tenants initially in federally subsidized housing, and then nearly all tenants facing a substantial loss of means. These laws, coupled with state-issued moratoria, reduced eviction filings by an estimated 1.5 million nationwide (reference) until they fully expired in October 2021. During this period, renters facing eviction found relief but also accumulated large rent bills, which were in part relieved by the federal stimulus funds, Child Tax Credit and Emergency Rental Assistance Program (ERA). The latter program allocated nearly $47 billion to provide direct support to low-income households making rent payments.
In Indiana, these programs have had a substantial impact. Some 60,000 residents of Indianapolis have benefitted from rental assistance managed through IndyRent.com. But with federal funds nearly depleted, as of July 29, 2022 both the statewide and Indianapolis programs have been paused and are no longer accepting new cases. (In Indianapolis, renters with active eviction cases are still being processed.) Rental assistance is drying up just at the moment when inflation is at a 40 year high, gas prices are spiking, and rental prices are up 70% in Indianapolis since 2020.
It would not be surprising to look back on this moment one year from now and mark it as the beginning of one of the worst periods of eviction on record.
Whether these programs and supports have lasting value and viability in the absence of direct rent payment assistance options remains to be seen. After 2.5 months of the Pre-eviction Diversion Program, a very small portion of cases (127) had entered into it. The eviction expungement law requires that tenants proactively file the right paperwork (available here). Legal support to tenants facing eviction did recently receive a significant boost from a $13.1 million statewide legal aid grant and the Indiana Community Action Association is now also receiving $15 million to provide housing counseling and case management services for those threatened by eviction (Eviction Task Force Final Report).
For 50 years, the responsibility of protecting the most vulnerable of our citizens from eviction has largely fallen on state, local, and private groups. Despite the federal policy interventions in the last two years, that pattern looks to continue. In cities like Indianapolis, outside of the diversion policies described above, direct support is limited and uncoordinated. Charitable organizations such as Community Action of Greater Indianapolis that provide emergency rental assistance can only support hundreds of the some 170,000 rental households in Marion County annually. Section 8 Housing Vouchers (administered through Indianapolis Housing Agency) provide support for some 8,000 families annually in Indianapolis —but the average wait time for a voucher is 49 months, and the waitlist is currently closed until further notice.
Eviction Trends
There were 11,520 eviction filings in the first six months of 2022. This is a six-month eviction filing rate of 6.7 percent. This means there are 6.7 filings for every 100 rental households.
Eviction filings are moderately correlated with income levels in a neighborhood, yet evictions are common in many wealthy areas and even some expensive apartment complexes. The problem of evictions is not limited to low-income neighborhoods. In Center Township, where poverty rates are highest, the six-month eviction rate is 6.0 percent. But Washington Township, the wealthiest township, had a six-month eviction rate of 6.2 percent. Wayne and Warren Townships had the highest six-month eviction rates, at 8.0 and 7.6 percent respectively.
The largest clusters of evictions are located in large apartment complexes in older suburban areas. These tend to be located near interstate highways.
Notes about this data
Our data covers eviction filings with hearings held between January and June 2022. Some of these were actually filed earlier than this period. An eviction filing could have multiple hearings or multiple court records. We deduplicated the data to only count unique eviction filings.
Eviction filings rates derived from this data cannot be directly compared to annual eviction filing rates published elsewhere because our data represent only six months.
This map shows the location of eviction filings color-coded by owner.
Zoom to too individual evictions. Select an owner name in the legend to filter by owner.
How have evictions changed over time?
Within this six month period, eviction hearings were highest in January and February. Hearings tended to be highest early in the month. There was a decline in hearings during April, which is typical as renters often have tax refunds to help catch up on rent bills.
Eviction hearings week-by-week
Number of eviction filings by the week in hearing was held
One tenth of people with eviction filings had at least two filings in six months
Eviction filings with hearings between January and June 2022
Serial evictions are more common among the top 50 evictors
Eviction filings with hearings between January and June 2022
Meanwhile, eviction laws in Indiana are aggressive, allowing landlords to post eviction notices effectively immediately after rent is late. In a typical case, tenants have 10 days to pay rent—and following a couple of court hearings, can be forcibly removed in a matter of a few days. Tenants have few rights when their housing is not meeting basic health standards. Unlike in other states, it is illegal for Hoosier tenants to withhold rent until an issue is resolved. Formal eviction is only one method by which tenants are displaced. Soft evictions can include harassment by landlords, being forced out by market forces or uncorrected housing conditions.
When tenants are forced out they not only lose their homes, but they often lose their neighborhoods and schools. By analyzing tenants with evictions at multiple addresses, we can trace how renters tend to be displaced across the city. First, we find that people tend to move to other properties in the same housing class: large multifamily to large multifamily, single family to single family, etc. Second, people are dispersed widely, with tenants moving between multifamily complexes around the periphery of the city or single family homes generally in the south of the city. Lastly, we found that people tended to move to neighborhoods with similar or worse socioeconomic conditions, school quality, and economic opportunity (see Opportunity Atlas), on average in the lower third of all tracts in Marion County.
Movement between multiple large multifamily complexes
Renters that are evicted from one large apartment complex often move to another complex in another part of the city entirely before being evicted again.

Movement between multiple single family homes or duplexes
Multiple evictions among renters of single family homes and duplexes are clustered in the south central part of the city.

Movement between single family homes and duplexes and large multifamily complexes
Renters evicted from single family homes in the central part of the city are often then later evicted from a large complex on the periphery.

Movement between large multifamily complexes and single family homes and duplexes
Some renters are evicted from large multifamily complexes on the periphery are then subsequently from more centrally located single family and duplexes.


Small number of owners account for a majority of evictions
There are over 2,000 property owners who have filed an eviction in the first half of 2022, but the 50 top evictors are responsible for 55 percent of evictions (6,338 eviction filings). These 50 entities own property under 336 different LLCs. By tracing property ownership, business registrations, and the addresses of companies’ agents and manager, we were able to determine the actual owner for 94 percent of records from frequent evictors (those with 10 or more filings in 2022).
These large evictors fall into three typologies.
- Multifamily investors are responsible for most evictions. These are typically private equity firms or real estate investment trusts that focus on buying older apartment complexes.
- Rental home aggregators buy thousands of single-family homes across the country. Six large aggregators with a presence in Indianapolis account for 13 percent of single-family evictions.
- Corporate owners of mobile home communities are also frequent evictors. 364 evictions were filed against mobile home residents. Nearly 80 percent were from five corporations.
The top 50 evictors drive weekly eviction trends
Eviction filings by week of hearing date and type of owner
Most evictions are filed against residents of large apartment buildings or complexes
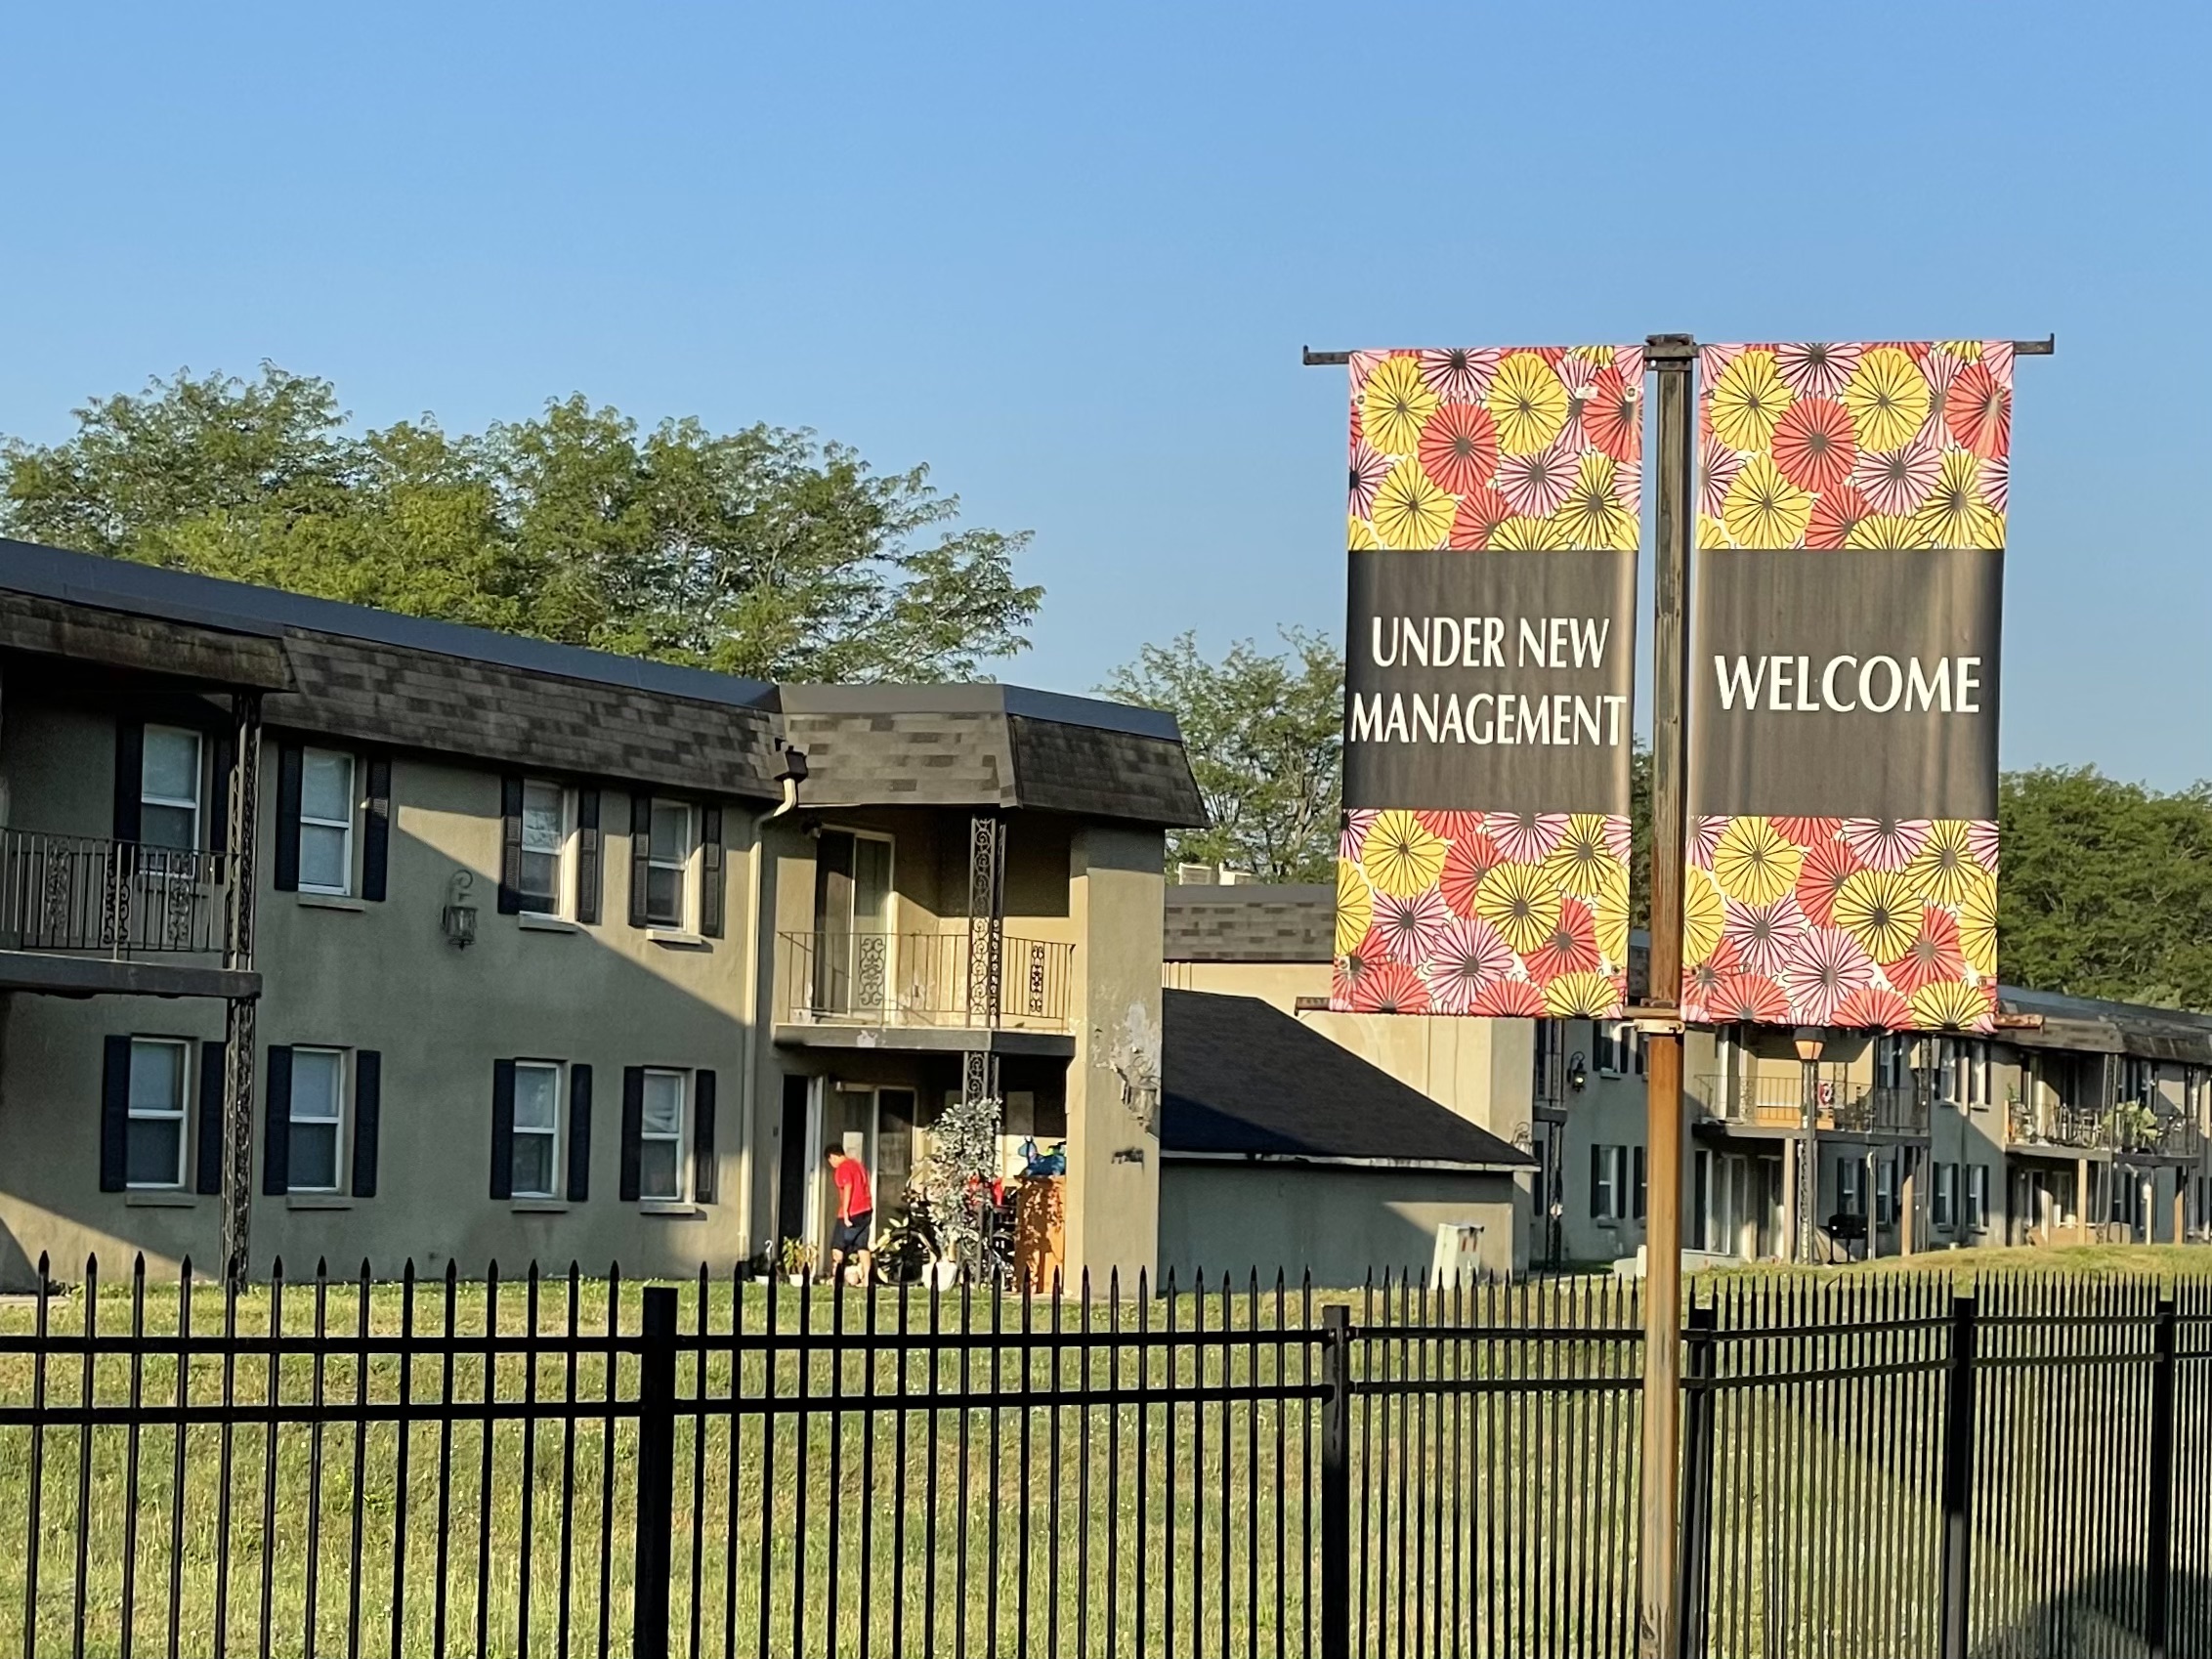
Owners of large multifamily developments are responsible for most of Indianapolis’ evictions so far in 2022. Most renters in Indianapolis live in a rental home or small apartment building, but most evictions are filed against residents of large complexes.
Forty-one percent of Indianapolis renter households live in either a single-family home or a duplex. Another 43 percent live in apartment buildings with between three and 19 units. Only 14 percent live in large apartment buildings with 20 or more units.
Despite this, 65 percent of evictions filings occurred in large complexes. Out of 11,519 eviction filings, 7,494 were large complexes.
Purchasing a large apartment complex requires a lot of capital, and the owners of these developments tend to be corporations or large private investment groups. For example, 58 percent of evictions in large complexes come from only 25 firms.
Eviction filings at large multifamily properties
Large multifamily properties are those with 20 or more apartments
How do we determine ownership?
We initially identify property owners of record by geocoding eviction claims and joining them to parcel property records. We then examine owners that possibly appear under different names or spellings, manually standardizing records that are presumed to be the same owner (e.g. EDWARD ROSE OF INDIANA = EDWARD ROSE OF INDIANA LP). About 15% of all records are corrected in this manner. Once these names have been standardized, we then do a detailed investigation tracing the property ownership, business listings, addresses of the companies’ agents, managers, and holding companies to determine corporate ownership. We were able to determine the actual corporate ownership for 94% of records from frequent evictors (those with 10 or more filings in 2022).

Indianapolis, Indiana
Taggart Birge, CEO
Andrew Held, President
Owns property under these LLCs
NEW LAKESHORE 1 LLC, NEW LODGE LLC, NEW TRAILS AT LAKESIDE LLC, BH EDGEWATER II LLC, NEW EMERSON I LLC, NEW EMERSON II LLC, ENGLISH VILLAGE LLC, BH SCP ROSEDALE LLC, NEW EAGLE CREEK GARDENS ASSOCIATES, NEW E’LAAN LLC, NEW STONE RIDGE LLC, GC SUNCREST APARTMENTS LLC, NEW MAXWELL LLC, BH MAXWELL LLC, STONYBROOK LLC, NEW REGENCY PARK LP, CENTENNIAL BEECHMILL LLC
Evictions from this owner
- 8.1% six-month eviction rate (348 evictions, 4,310 units)
- In six months, evicted at least 365 people, including 97 people multiple times
- Birge and Held owns 20 developments across Indianapolis. English Village is the development with the highest eviction rate, at 28.4%.


New York, New York
Michael Betancourt, Managing Partner
Siraj Dadabhoy, Chairman
Owns property under these LLCs
AP GEORGETOWN TIC 1 LLC, AP GEORGETOWN TIC 2 LLC, AP GEORGETOWN TIC 3 LLC, AP MERIDIAN HILLS TIC 1 LLC, AP MERIDIAN HILLS TIC 2 LLC, AP MERIDIAN HILLS TIC 3 LLC, AP CREEKSIDE TIC 1 LLC, AP CREEKSIDE TIC 2 LLC, AP CREEKSIDE TIC 3 LLC
Evictions from this owner
- 22.2% six-month eviction rate (317 evictions, 1,430 units)
- In six months, evicted at least 336 people, including 17 people multiple times
- Aion Partners owns three developments in Pike Township on the northwest side. The George has an eviction rate of 35.7%, The Meridian North has an eviction rate of 27.6%, and The Meridian South has an eviction rate of 14.4%.


Nashville, Tenessee
Frederic Scarola, Managing Partner
Govan White, Managing Partner
Owns property under these LLCs
CENTURY MULTIFAMILY PARTNERS LLC, ISLAND CLUB MULTIFAMILY PARTNERS LLC, PARK CENTRAL MULTIFAMILY PARTNERS LLC, SOLANA MULTIFAMILY PARTNERS LLC
Evictions from this owner
- 20.2% six-month eviction rate (216 evictions, 1,069 units)
- In six months, evicted at least 259 people, including 46 people multiple times
- Covenant Capital Group owns four developments in Washington Township on the north side and Wayne Township on the west side. Solana at the Crossing has an eviction rate of 6.5%, which is average compared to the city overall. Island Club and The Jameson, which rent for $1,000 to $1,600, have eviction rates over 29%. The Everly at Meridian Hills has an eviction rate of 20.4%. With rents of $1,400 to $2,000, these units are not targeted to low-income households.

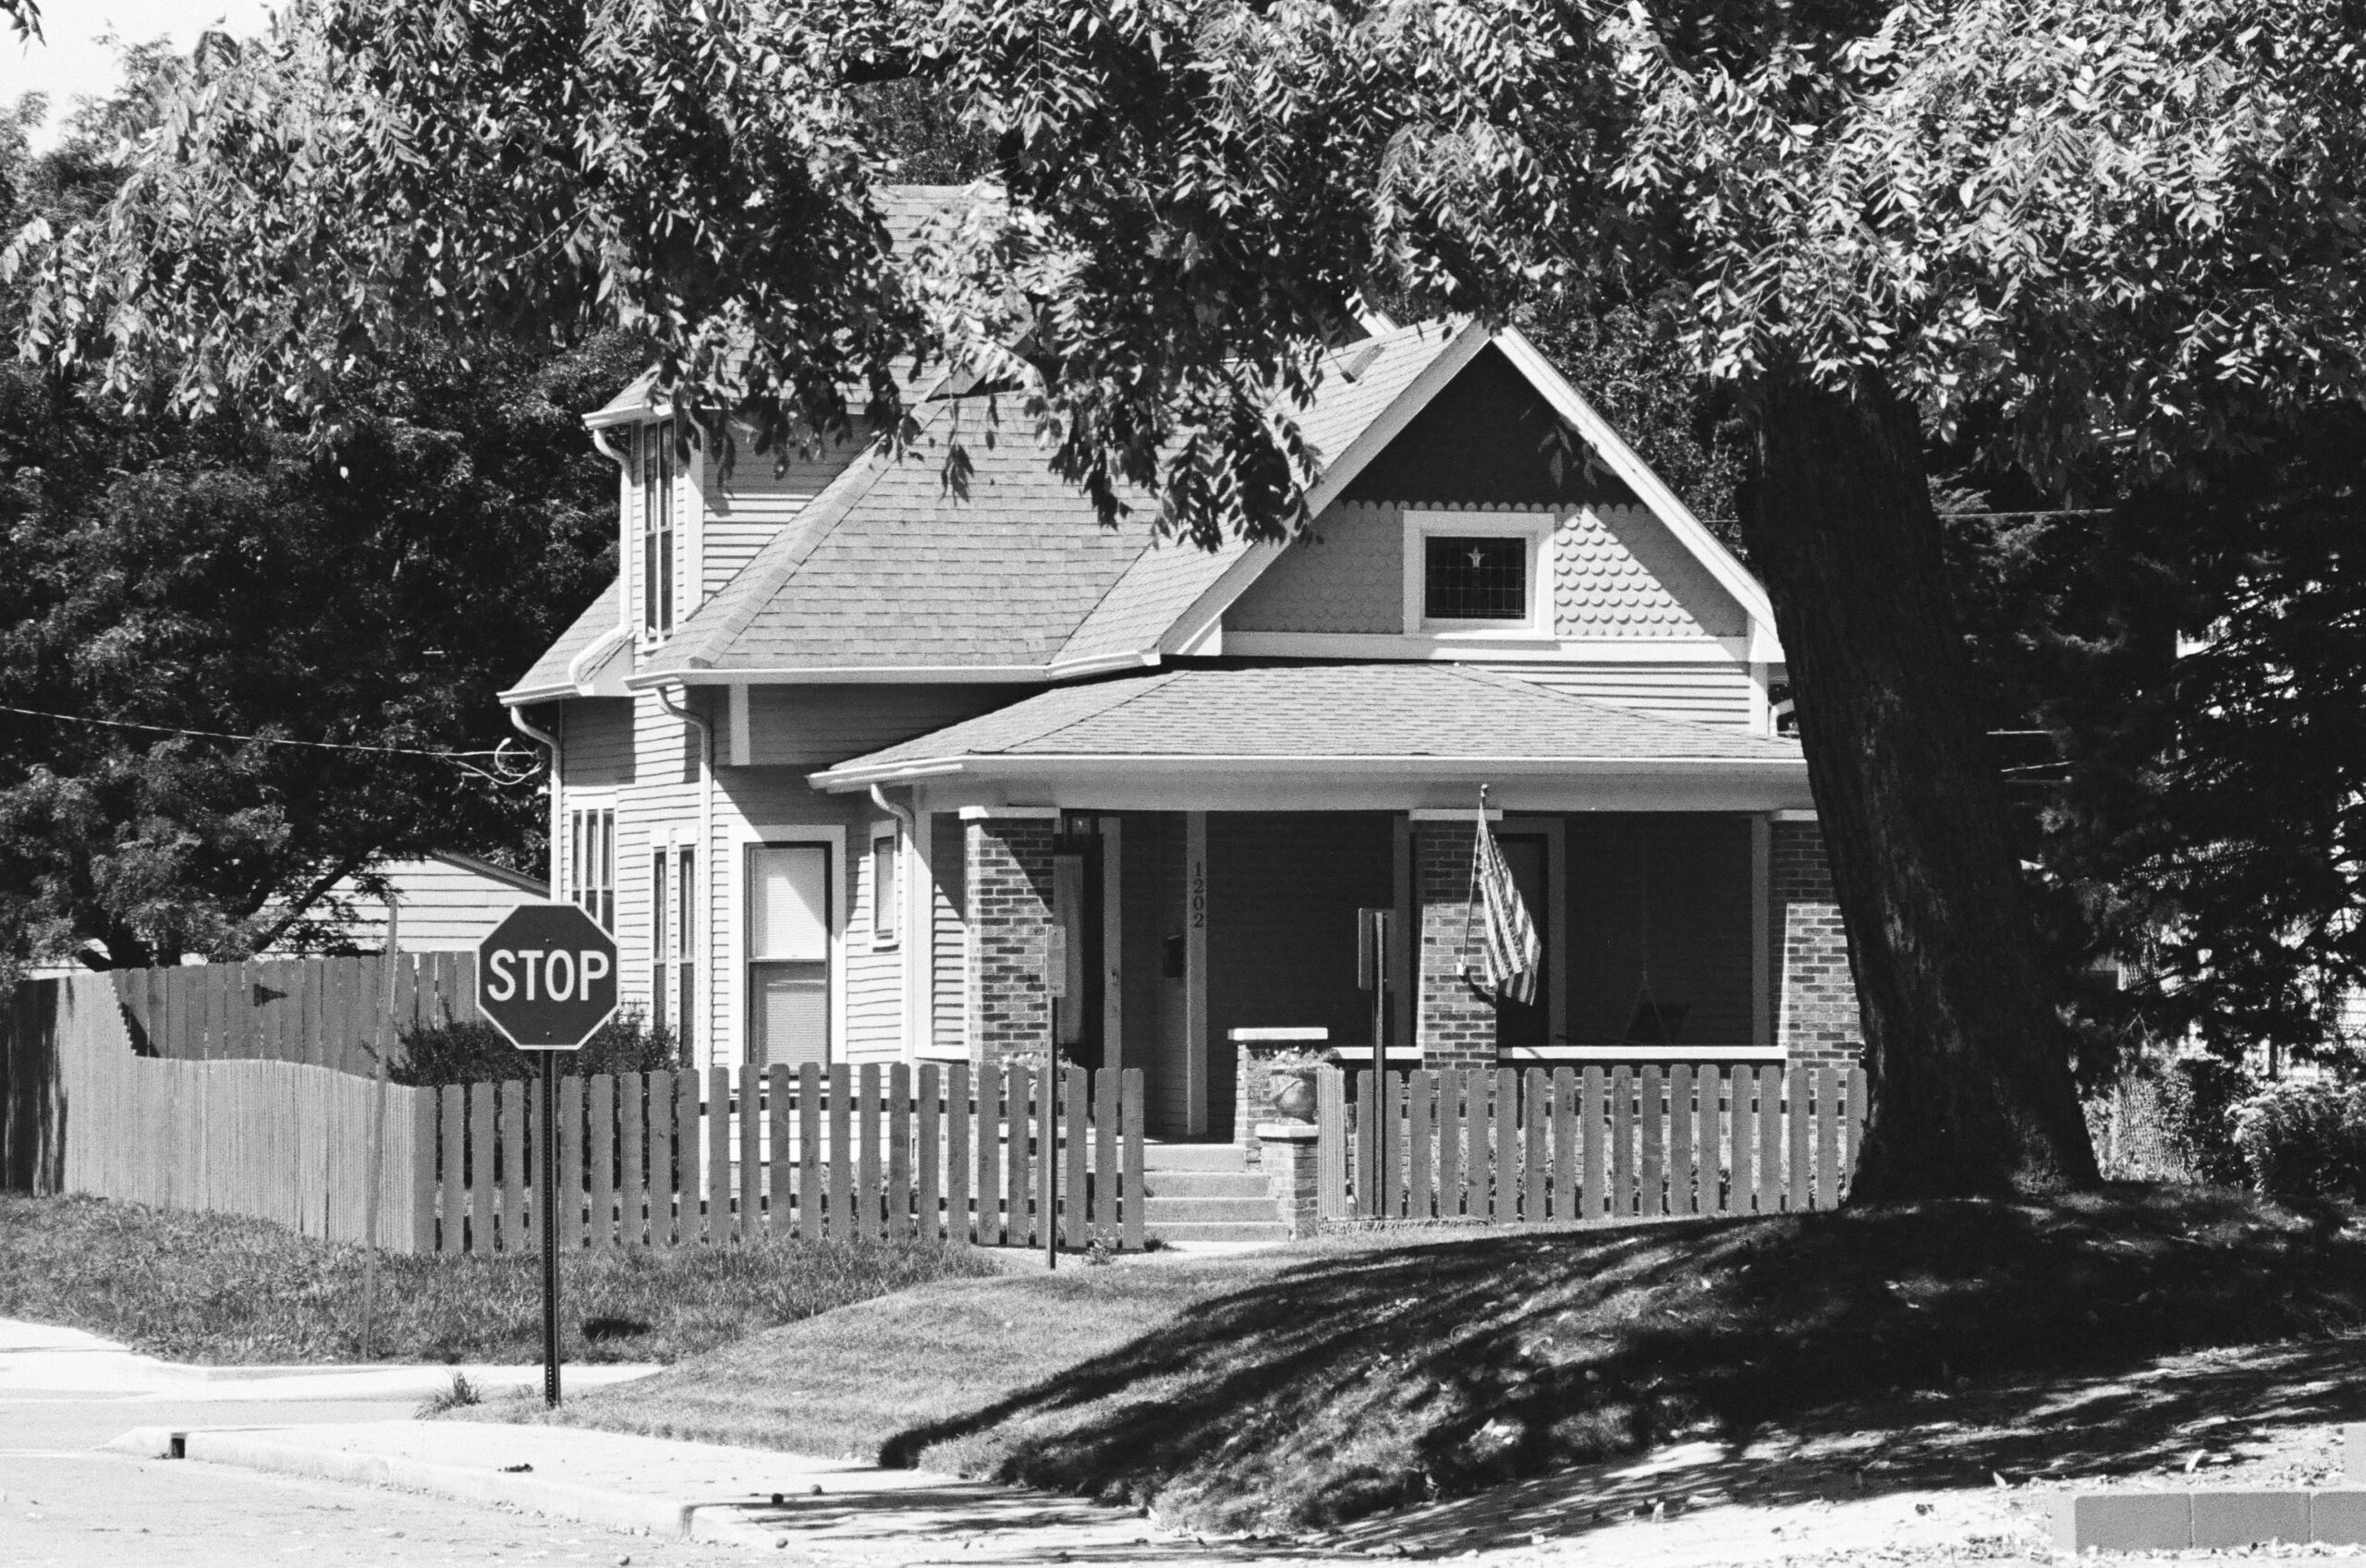
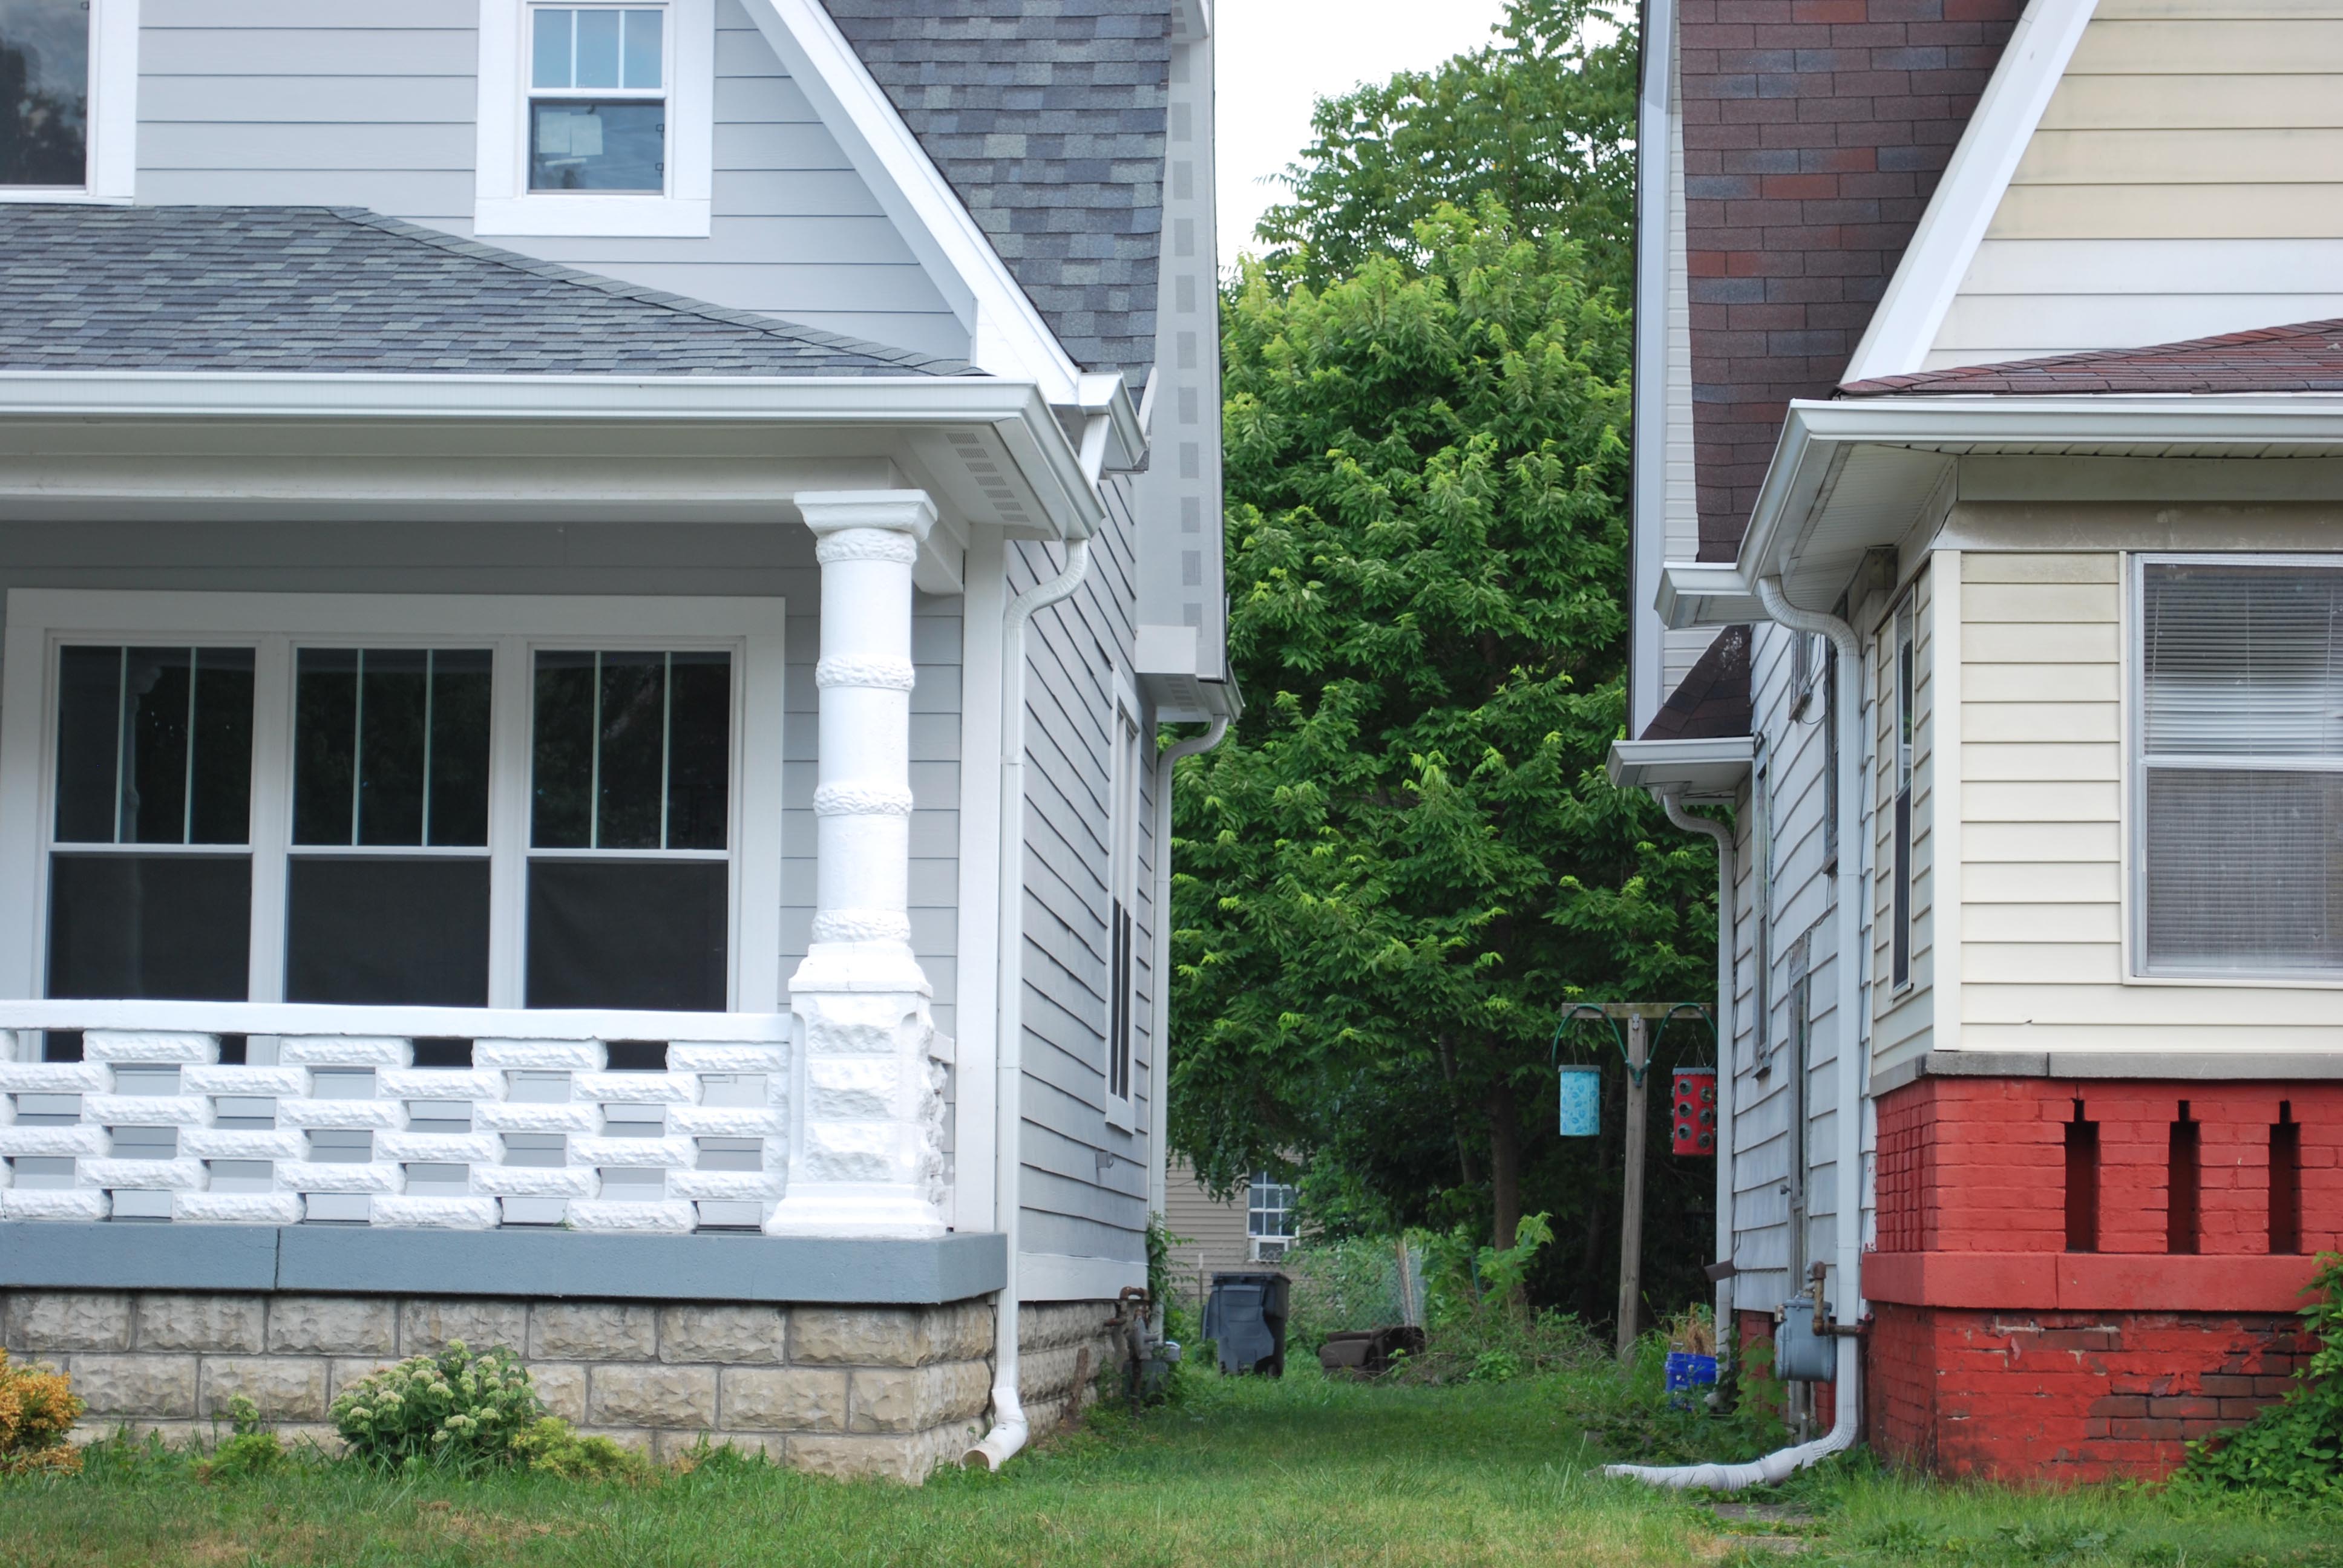
Single-family and duplexes are less consolidated among large owners
The 2,703 evictions against residents of single-family and duplex rental homes come from hundreds of owners. Frequent evictors were responsible for only 23 percent of evictions, and even many of those frequent evictors are individuals or family investment partnerships.
Still, there are some corporate players in the rental home market. Of the 22 entities that are frequent single-family evictors, half are national corporations. These 11 corporations are responsible for 18 percent of all single-family evictions in Indianapolis.
Eviction filings at single-family and duplex properties
Classified as single-family residential, condos, or apartments with two units

Dayton, Ohio
Dana Sprong, Founder and Managing Partner
Owns property under these LLCs
NREA VB II LLC, NREA VB V LLC, TRUE FM2017 1 LLC, VB ONE LLC, VB TWO LLC
Recently acquired property still listed under these LLCs
CONREX RESIDENTIAL PROPERTY, CONREX RESIDENTIAL PROPERTY GROUP, CONREX RESIDENTIAL PROPERTY GROUP 2013-1, CONREX RESIDENTIAL PROPERTY GROUP 2013-1 LLC, CONREX RESIDENTIAL PROPERTY GROUP 2013-2, CONREX RESIDENTIAL PROPERTY GROUP 2013-3, CONREX RESIDENTIAL PROPERTY GROUP 2013-4, CONREX RESIDENTIAL PROPERTY GROUP 2013-6, CONREX RESIDENTIAL PROPERTY GROUP 2013-9, CONREX RESIDENTIAL PROPERTY GROUP 2016-01, CONREX RESIDENTIAL PROPERTY GROUP 2016-03,REX RESIDENTIAL PROPERTY OWNER III LLC, CONREX ML PORTFOLIO 2019-01, CONREX RESIDENTIAL SMA I 2018-01 OPERATING, CONREX RESIDENTIAL PROPERTY GROUP 2016-02, REX RESIDENTIAL PROPERTY OWNER A LLC, CONREX RESIDENTIAL PROPERTY GROUP
In 2021, the company acquired a portfolio of Indianapolis homes from Conrex, another aggregator of single-family rental homes. This brings their total number of homes in Indianapolis to 1,340, according to their quarterly report. Our analysis was able to identify 1,309 units owned by them. We use this figure as the basis for estimating their eviction rate.
Evictions from this owner
- 7.9% six-month eviction rate (103 evictions, 1,309 units)
- In six months, evicted at least 114 people, including 7 people multiple times
- Vinebrook Homes owns 1,309 units across the city. About half of these units are in Warren and Lawrence Townships, but they have a presence in all part of Indianapolis. The eviction rate for these properties is only slightly above Indianapolis’ overall average, indicating that Vinebrook is responsible for so many evictions mostly because they are such a large property owner.

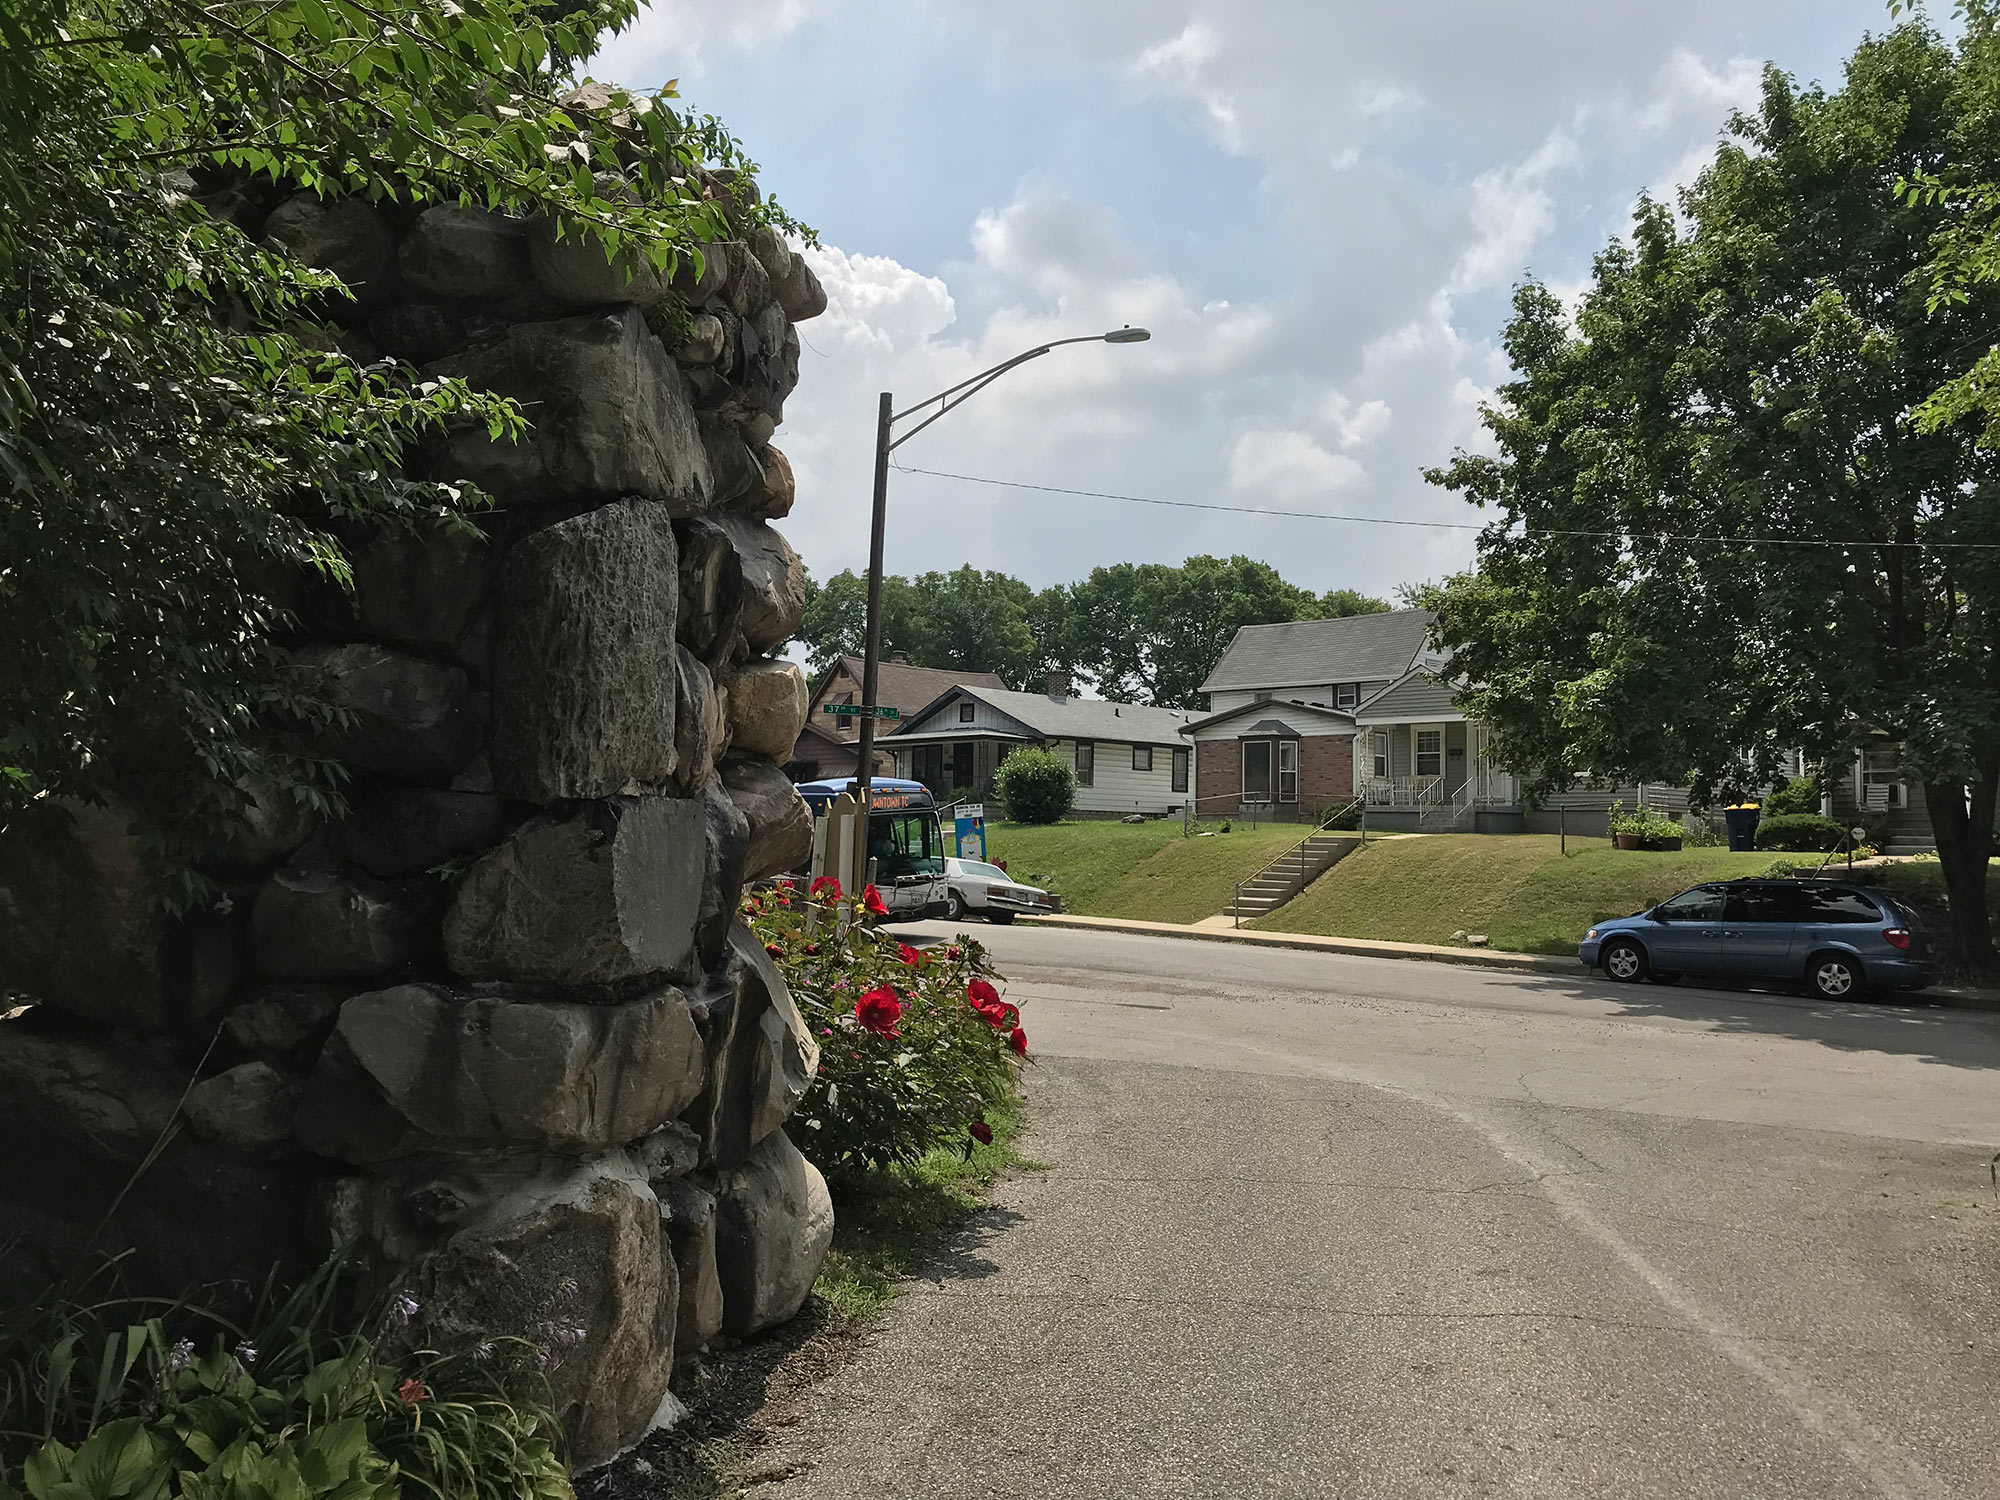
Mobile home parks are also eviction hotspots
Overall, mobile homes had six-month eviction rate of 13 eviction filings per 100 units in the first half of 2022. The eviction rate excluding mobile homes is 6.7 per 100 units. Mobile homes make up only 1.7 percent of rental units, but account for 3.2 percent of evictions.
A few key players are responsible for nearly all these evictions. Five companies are responsible for 79 percent of mobile home evictions: Yes! Communities (owned by Stockbridge Capital), Mission Peak Capital, RHP Properties, Cohron’s Manufactured Homes, Longacre Mobile Home Community.
Eviction filings at mobile home parks

San Fransisco, California
Terry Fancher, Executive Managing Director
Sol Raso, Executive Managing Director
Owns property under these LLCs
FSI VALLEYBROOK PROPERTY LLC, MC HICKORY KNOLL PROPERTY LLC, MC MARIWOOD PROPERTY LLC
Evictions from this owner
- 8.9% six-month eviction rate (125 evictions, 1,398 mobile home sites)
- In six months, evicted at least 146 people, including 27 people multiple times
- Yes! Communities operates three mobile home parks on the south and west side of Indianapolis: Valleybrook, Hickory Knoll, and Mariwood. The largest is Valleybrook, which has 812 sites and 91 eviction filings in the first half of 2022.

Relationship between Health Code Violations and Evictions
Some apartment complexes are infamous for their poor living conditions, such as Lakeside Pointe or Berkley Commons. Tenant rights advocates warn that without legal protections, tenants can be evicted as retribution for a complaint to the health department. We analyze every housing code violation and health department investigation in the first half of 2022 to see how these factors are related.
A few properties are responsible for most complaints. Out of 77,000 rental parcels (including apartments, single-family rental homes, mobile homes, and motels), 2,559 had any housing code violation or health department investigation during between January and June 2022. Most of these properties only received one or two complaints (78 percent). The other 22 percent received three or more complaints in six months. One hundred properties account for one third of all complaints.
Evictions are more common among properties with complaints. Among the 74,000 properties with no complaints, 4,039 evictions were filed—that is a rate of five filings for every 100 properties. Among the 2,558 properties with a complaint, 6,315 evictions were filed—247 filings for every 100 properties.
Put another way, properties with at least 10 complaints filed in this six-month period represent one thousandth of one percent of rental properties. Yet these 93 locations account for one third of complaints and one fifth of eviction filings.
This map shows every health department complaint against a rental property in the first six months of 2022.
Zoom in and click on a red dot to see how many complaints have been filed against that address, how many evictions filed at that address, and who owns the property.
Genesis Housing Foundation tops the list, mostly because they recently acquired Lakeside Pointe in Nora from JPC Affordable Housing Foundation. That property alone had 281 complaints and 136 violations in six months. Even after offloading that property, JPC still ranks second. They own four apartment complexes across Indianapolis, where they have filed 175 evictions in the first half of 2022.
JPC’s housing violations are not unique to Indianapolis. An investigation in Chicago found them to be negligent property owners. The Chicago Housing Authority withheld voucher payments to a related nonprofit, Better Housing Foundation, because of housing code violations. The organization defaulted on $170 million in bonds and sold its properties to Pangea Property Group. The State of Indiana sued JPC over the conditions of its properties, and JPC’s parent was even sued for the wrongful death of a man in an apartment with a broken air conditioner.
While JPC is registered as a nonprofit, they appear to be related to Apex Equity Group, a for-profit real estate investor. Apex and JPC share an address (10 Hill Street, Newark, New Jersey). On their website, Apex says the company began under the name PF Holdings. On an IRS form, PF Holdings is listed as the organization that holds JPC’s “books and records” and a lawsuit from the State of Indiana identifies PF Holdings as JPC’s parent company.
Apex Equity Group is a New Jersey-based company that claims to have $9 billion in assets under management and is run by the Puretz family. Their website lists Aaron Puretz and Eli Puretz as president and head of acquisitions, respectively. Another man, Chaikel Puretz, is cited as the chief executive of PF Holdings, and Aaron Puretz has joined with a man named Lieb Puretz as the plaintiff in suit over a development on which they partnered. The family is known for their Staten Island developments.
Conclusion
Most of Indianapolis’ eviction filings are from large owners of large multifamily developments. The causes for evictions from these large owners are not always an insurmountable web of socioeconomic and structural inequalities: These evictions are driven by company policy and allowed by state laws. Changing these laws to benefit tenants will not only reduce evictions now, but will also make Indianapolis less attractive for multifamily private equity. This will reduce our eviction problem in the future. Indiana’s current policies are nationally known as landlord friendly and actively invite frequent evictors.
Increasing the amount of time between a missed payment and an eviction filing will both benefit renters and discourage landlords from using evictions as easy debt collection. Limiting late fees for tenants and increasing eviction filing costs for landlords would shift the economic balance, making eviction a less profitable property management tool. Finally, state laws like the proposed Senate Bill 230 would give tenants more recourse to force landlords to address housing conditions and prevent retaliatory evictions.
Which owners receive the most health department complaints?
Complaints (investigations) and housing violations between January and June 2022
Data sources
Eviction filings are from the Indiana Supreme Court. They include all eviction claims filed in Marion County Superior Court or any of the county’s township courts. These records are all claims with hearings that fell between January 1, 2022 and June 30, 2022.
Housing violations and complaints are from Marion County Public Health Department. These records contain all violations issued between and January 1, 2022 and June 30, 2022 and complaints (called investigations) filed between January 1, 2022 and June 30, 2022. Some of these complaints may also become violations within the same time period. Therefore, complaints and violations cannot be added together.
Property type and ownership came from IndyGIS parcel records as of July, 2022.
Information about the number of renters and the property types where renters live came from the American Community Survey Five-Year Average from 2016-2020.
Next Up
 Modern Redlining in Indianapolis?
Our analysis of one million loan applications since 2007 shows that, even when income and debt are the same, having a Black applicant on the loan increases the odds of being denied by 2-3X, and applying for a loan in a historically redlined neighborhood increases the odds of denial by 50 percent.
 After Public Investment, St. Clair Place’s Housing Market Significantly Stronger
Mortgage activity in St. Clair Place shows a dramatic increase in home purchases and home value since 2007. The area is more diverse than ever and poverty is falling for people of color. But home buyers are still 76 percent white.
 With New Park Planned in Fishers, How Do Parks Relate to Property Value?
Indy has 51 sq. meters of park per person, while Fishers has only 4.3 sq. meters per person. In some neighborhoods, properties close to parks are worth more, in some they are worth less. On average, property near parks is worth $5K less than others in that neighborhood.
 Income Inequality High Where Golden Hill and Northwest Indianapolis Converge
In the area where wealthy Golden Hills converges with the working-class neighborhoods of Northwest Indianapolis, income inequality is high and increasing. The area is also experiencing a growth of white households above the median income.