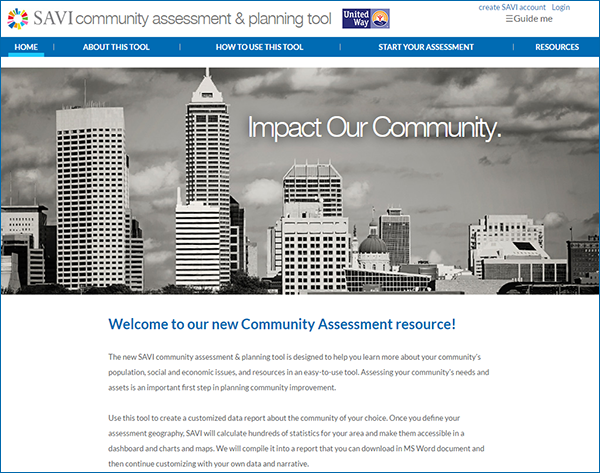
Assessing your community’s needs and assets is an important first step in planning community improvements. In fact, users report “community assessments” as the number one use of the SAVI community information system, helping them make more informed decisions about program priorities and identifying existing community resources.
We’ve made this process much simpler for you with the easy-to-use SAVI Community Assessment & Planning Tool. The big improvement is that it streamlines planning, pulling together the most critical demographic, socio-economic, and community asset data. It is the perfect resource to help you quickly identify areas of concern and disparities by race, age, gender, income, and education level.
How does this differ from SAVI’s other tools? It draws in the same detailed data you are accustomed to in SAVI, but it saves you the hassle of mining thousands of data options and from having to summarize your data and create custom charts and maps. This tool does it all for you, saving hours of data compilation.
Users walk through a basic community assessment framework, which provides data to support each step: assess needs, identify assets, and define gaps and opportunities. It allows you to define a custom geographic area, view dashboards, and drill into interactive data visualizations. The data format makes it easy for nonprofits to understand needs, socio-economic and geographic disparities, existing programming, and gaps in their service area.
The greatest innovation is that it generates a custom and updatable report containing the assessment data and visualizations for a chosen geography in Central Indiana in an editable MS Word format. You can then continue customizing it with your own data and narrative. Please check it out!


