
Key points
-
Both rural and suburban areas have median incomes 50% higher than urban areas.
-
Urban areas have unemployment rates at least 50% higher than rural or suburban areas.
-
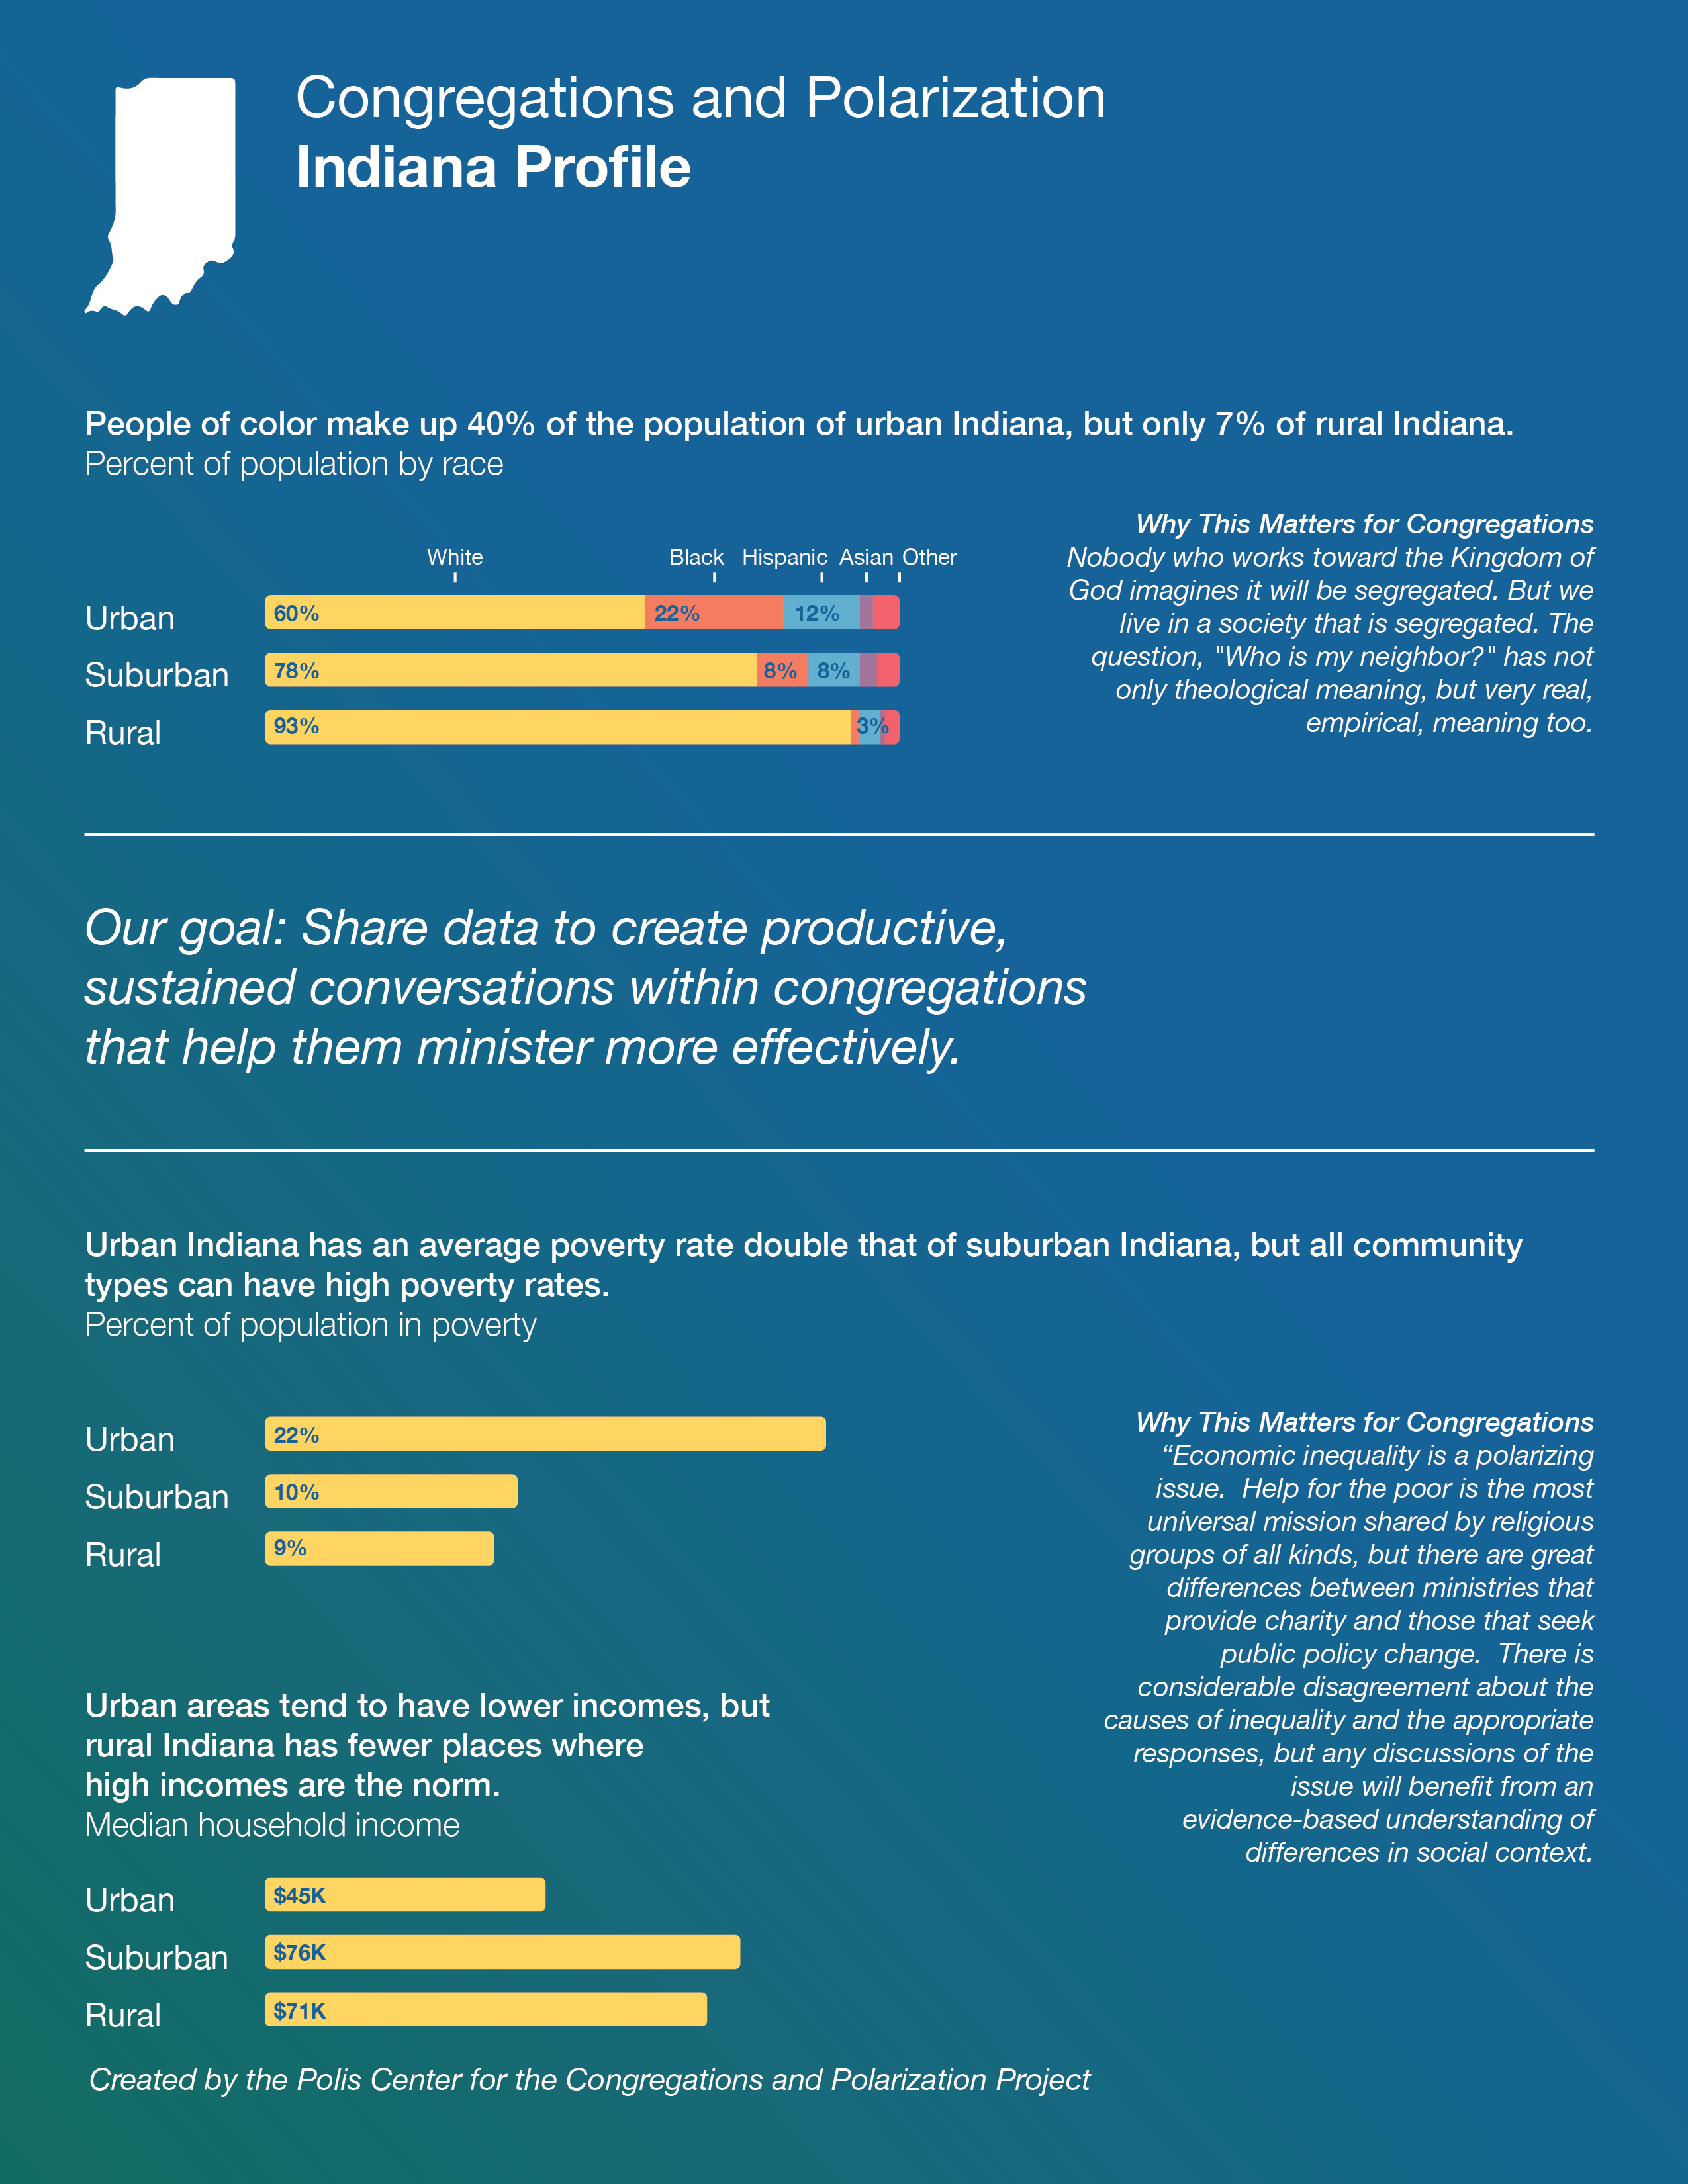
People of color make up 40% of urban areas but only 7% of rural areas and 22% of suburban areas.
Urban and Suburban
The Congregations and Polarization project intends to describe and analyze the many ways religious congregations are responding to cultural and political polarization. The project is housed in the Center for the Study of Religion and American Culture at Indiana University Indianapolis and funded by a generous grant from the Lilly Endowment. The data analyzed in this report was organized by The Polis Center, also at Indiana University Indianapolis. The ideas and analysis represented here are the interpretations of project staff and do not necessarily reflect the views of the Lilly Endowment, Polis, the Center for the Study of Religion and American Culture, or Indiana University.
In a highly contentious presidential election year, a steady drumbeat of stories and reports will focus attention on issues that divide American voters into cultural and political camps. Such issues include critical race theory, gender identity, immigration, gun ownership, abortion, animal rights, and others. The Congregations and Polarization (CAP) project seeks to explain the ways Indiana’s religious congregations are framing their missions and ministries in communities shaped by these well-documented divisions.
We know from past research that congregations’ responses will differ considerably. Some will experience serious cultural conflict within their own ranks, but most will not, because many congregations have already sorted into culturally and politically homogeneous camps. Some will try to keep all discussion of these divisions outside their congregation’s walls, seeing politics as a distraction from their spiritual mission. Some will try to be peacemakers, often searching for some moderate, purple, center between red and blue. And some will join the fray, likely also hoping for peace, but committed to creating changes they believe are just.
The CAP project is based on two important assumptions. The first assumption is that these culturally divisive issues are grounded not simply in differences of personal opinions or values, but also in different interpretations and experiences of these issues that must be understood in specific social contexts. Because we are working across the state of Indiana, we begin with social differences among rural, urban, and suburban contexts. The discussions taking place in these different areas do not start with the same assumptions and do not share the same definitions of the problems. School boards in these different locales do not argue about the same issues. People’s daily experiences can be quite different depending on where they live and this clearly influences their shared opinions and attitudes. So rather than holding inclusive conversations at the statewide level that might lead toward mutual understanding and community wellbeing, we often have multiple conversations running on very different tracks. Put most bluntly: Discussions about problems of race, inequality, immigration and the rest are not framed the same in these different contexts. This makes productive engagement on these issues very difficult.
The second assumption is that congregations seek to build community in ways that most social organizations do not and cannot. Congregations are communities and they serve communities. And these communities are themselves deeply shaped by the social contexts in which they operate. Congregations seeking to address certain difficult issues in rural Indiana will have a very different conversation than congregations in urban or suburban areas. For instance, discussions about gun ownership and gun violence will be framed differently in a rural community where many of the residents go hunting than in an urban area where guns are most often associated with violence. Conversations about animal rights will be different in a farming community than in one where most animals that people own are pets. Even conversations about difficult issues such as the role of historical and systematic racism play out very differently in an environment where there are very few Black people. The principles may be the same, but the lived, daily, experiences shape the ways decisions are made and resources are used.
Therefore, the first step in the Congregations and Polarization project is to develop a clearer picture of differences and similarities in these three different parts of Indiana: rural, urban, and suburban. To do this, our colleagues at Polis used the best-available methodology from the Department of Housing and Urban Development to separate Indiana into urban, rural, and suburban areas. This method is especially helpful because it asks residents how they would describe the place where they live, rather than only relying on a measure such as housing density. Polis then used data from the U.S. Census Bureau’s American Community Survey (2017–2021) to point out important differences and similarities among these areas. In this exercise, all urban areas are lumped into one group, all rural areas into a second group, and all suburban areas into a third.
Recognizing, however, that not all urban or rural or suburban areas are necessarily identical, we took the further step of creating eight different, smaller, study areas for deeper analysis. These are: Marion County (Indianapolis), the Indianapolis suburbs (technically the 2023 Indianapolis-Carmel-Greenwood Metropolitan Statistical Area (MSA) minus Marion County), The Region (five counties in northwest Indiana including the cities of Gary and Hammond), Elkhart County, Allen County (Fort Wayne), Bartholomew and Jackson Counties, Ohio and Ripley Counties, and Crawford County. These study areas represent very different parts of the state and will, in some cases, show differences within the rural or urban or suburban classifications that would not otherwise be apparent.
We encourage readers to sort through the data on their own and to think about information that confirms or challenges their prior assumptions. We have provided introductory analysis of differences and similarities we think may be important for understanding the contexts in which congregations work. This report is a first step because, in the end, this is a project about congregations and this information is meant to provide needed background for that effort, rather than public policy analysis.
Our deepest hope is that this data will spur productive, sustained conversation within religious communities about their mission goals and the context in which they operate. Beyond this, we hope to inform public officials and civic leaders who are thinking about the public role of congregations. And they should be thinking about that role: Religious congregations are on the front lines of many different socially divisive issues. They are frequently the first stop for people seeking help. They are intimate, supportive, communities of ordinary people who mean to make the world a better place. If they cannot contribute to a shared vision of our lives together, if they cannot sustain conversations about fraught topics, what organizations can?
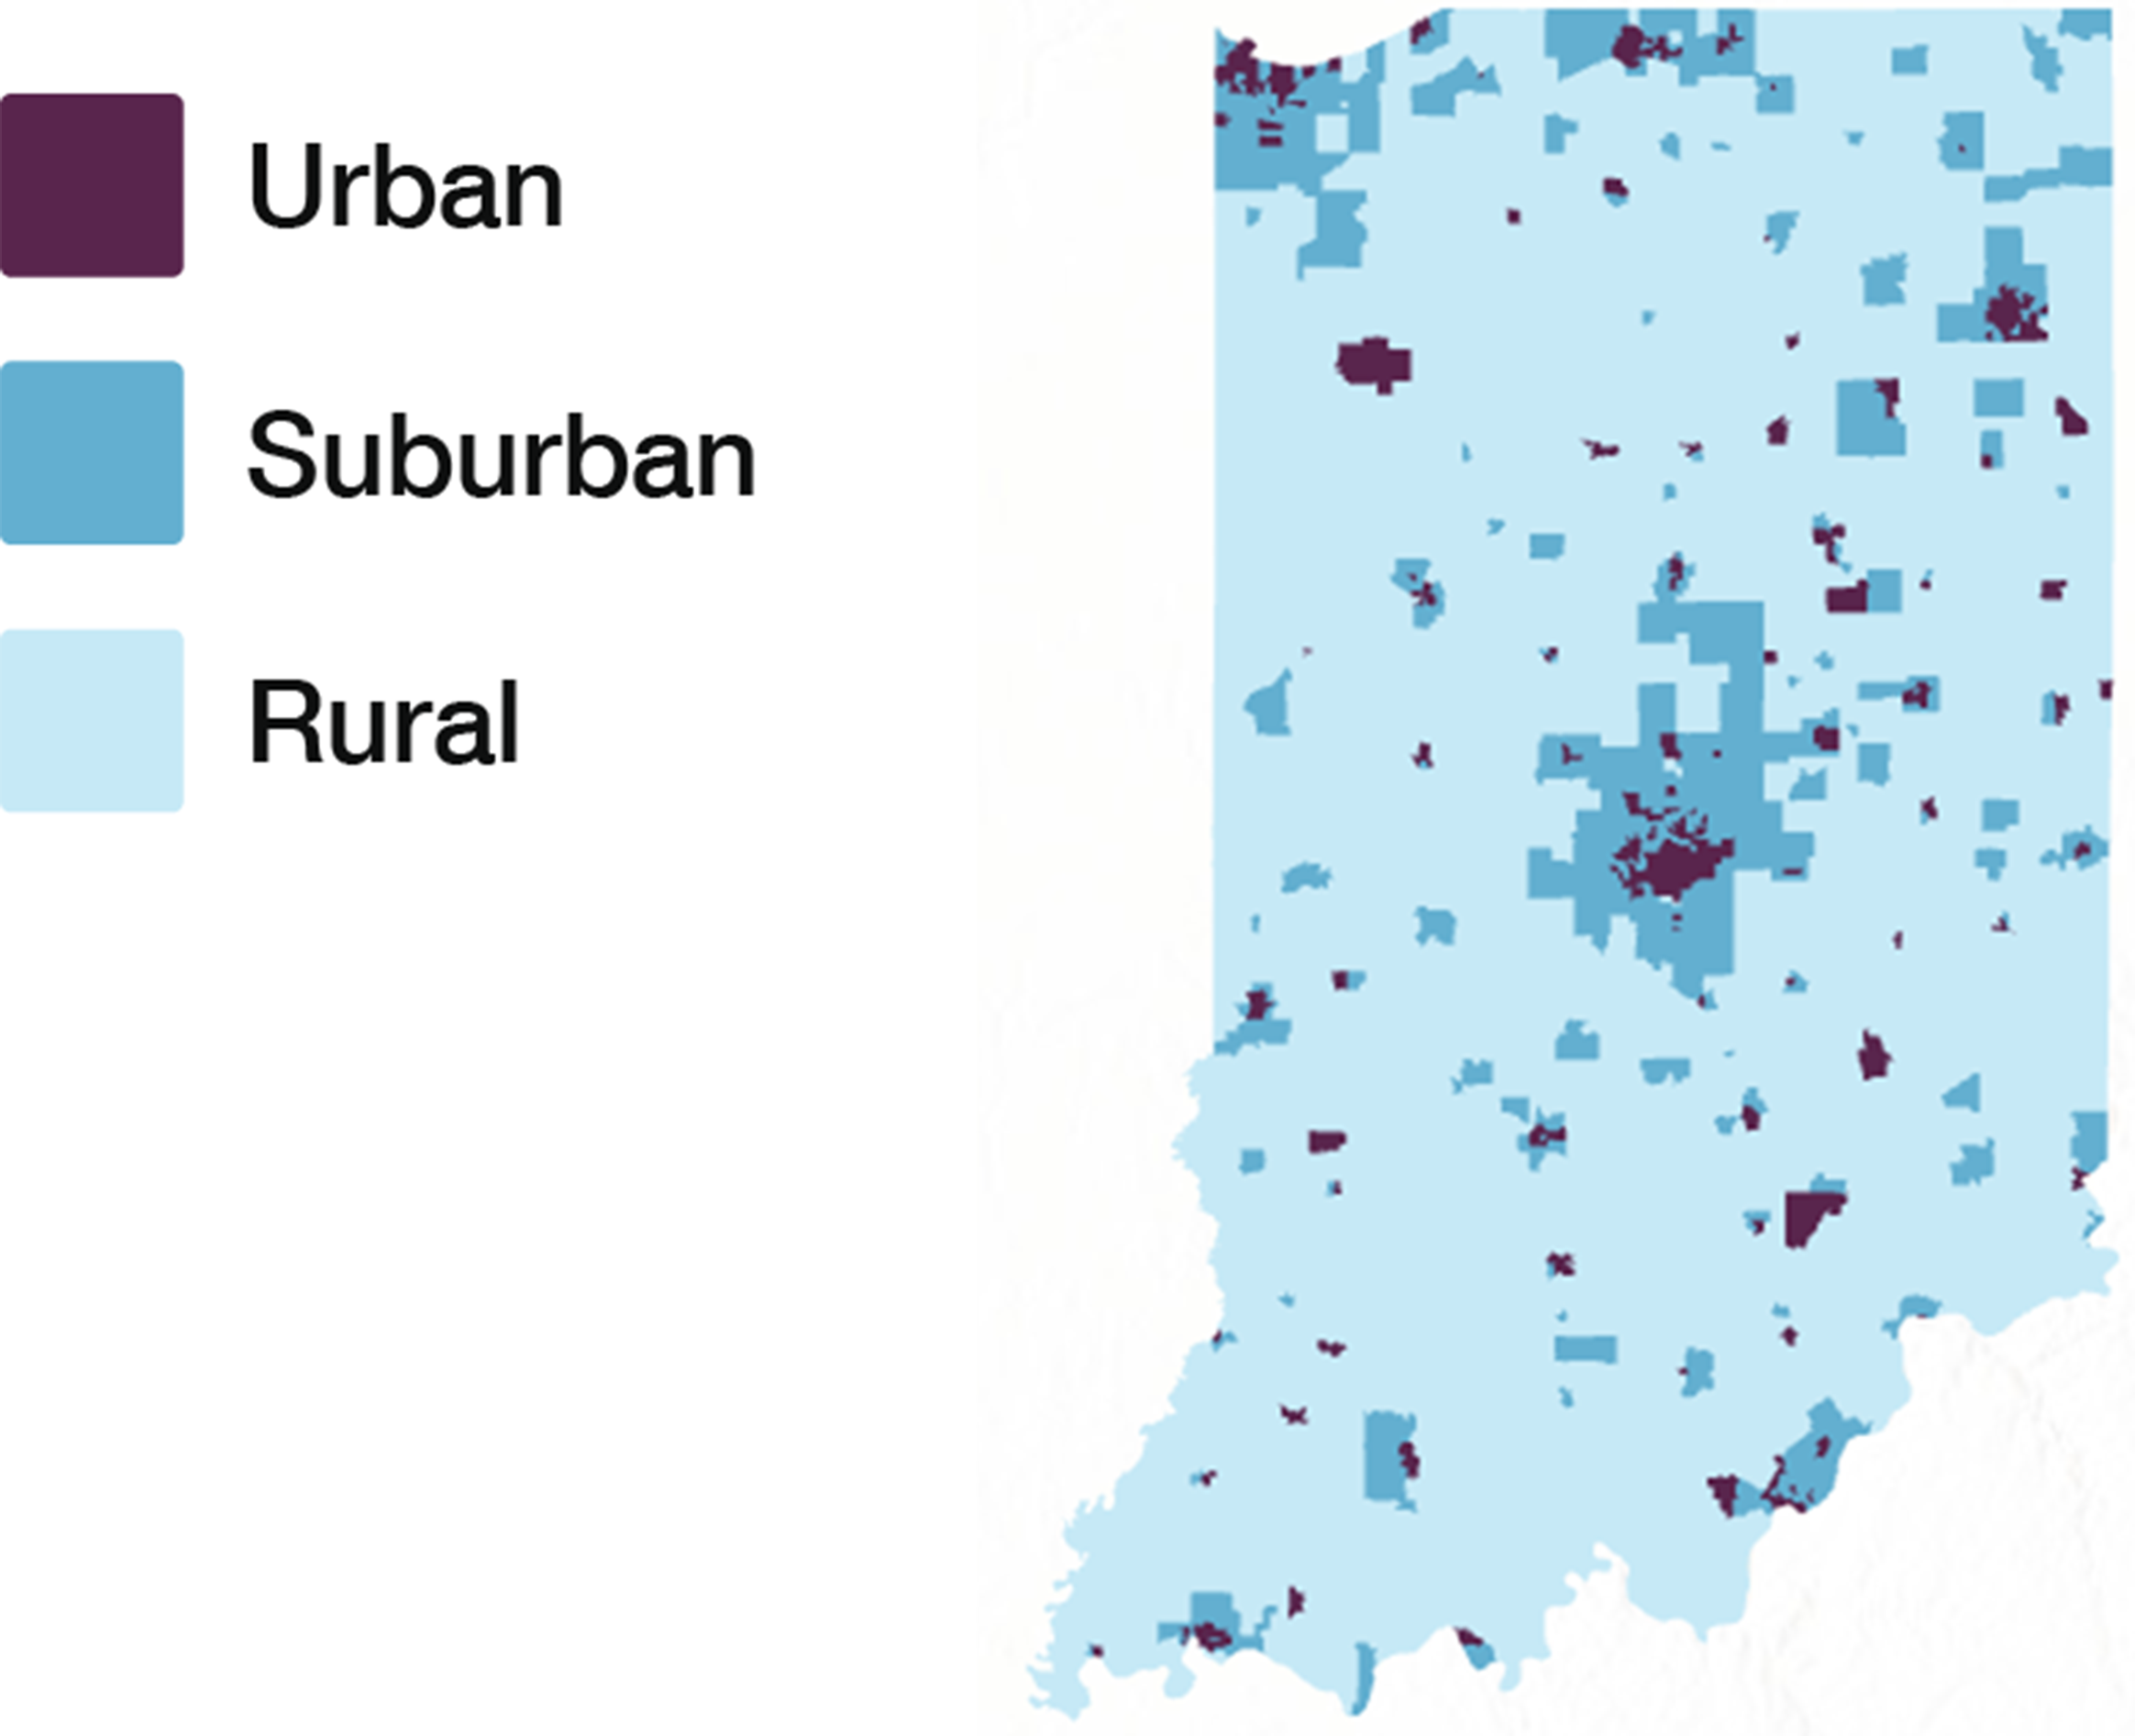
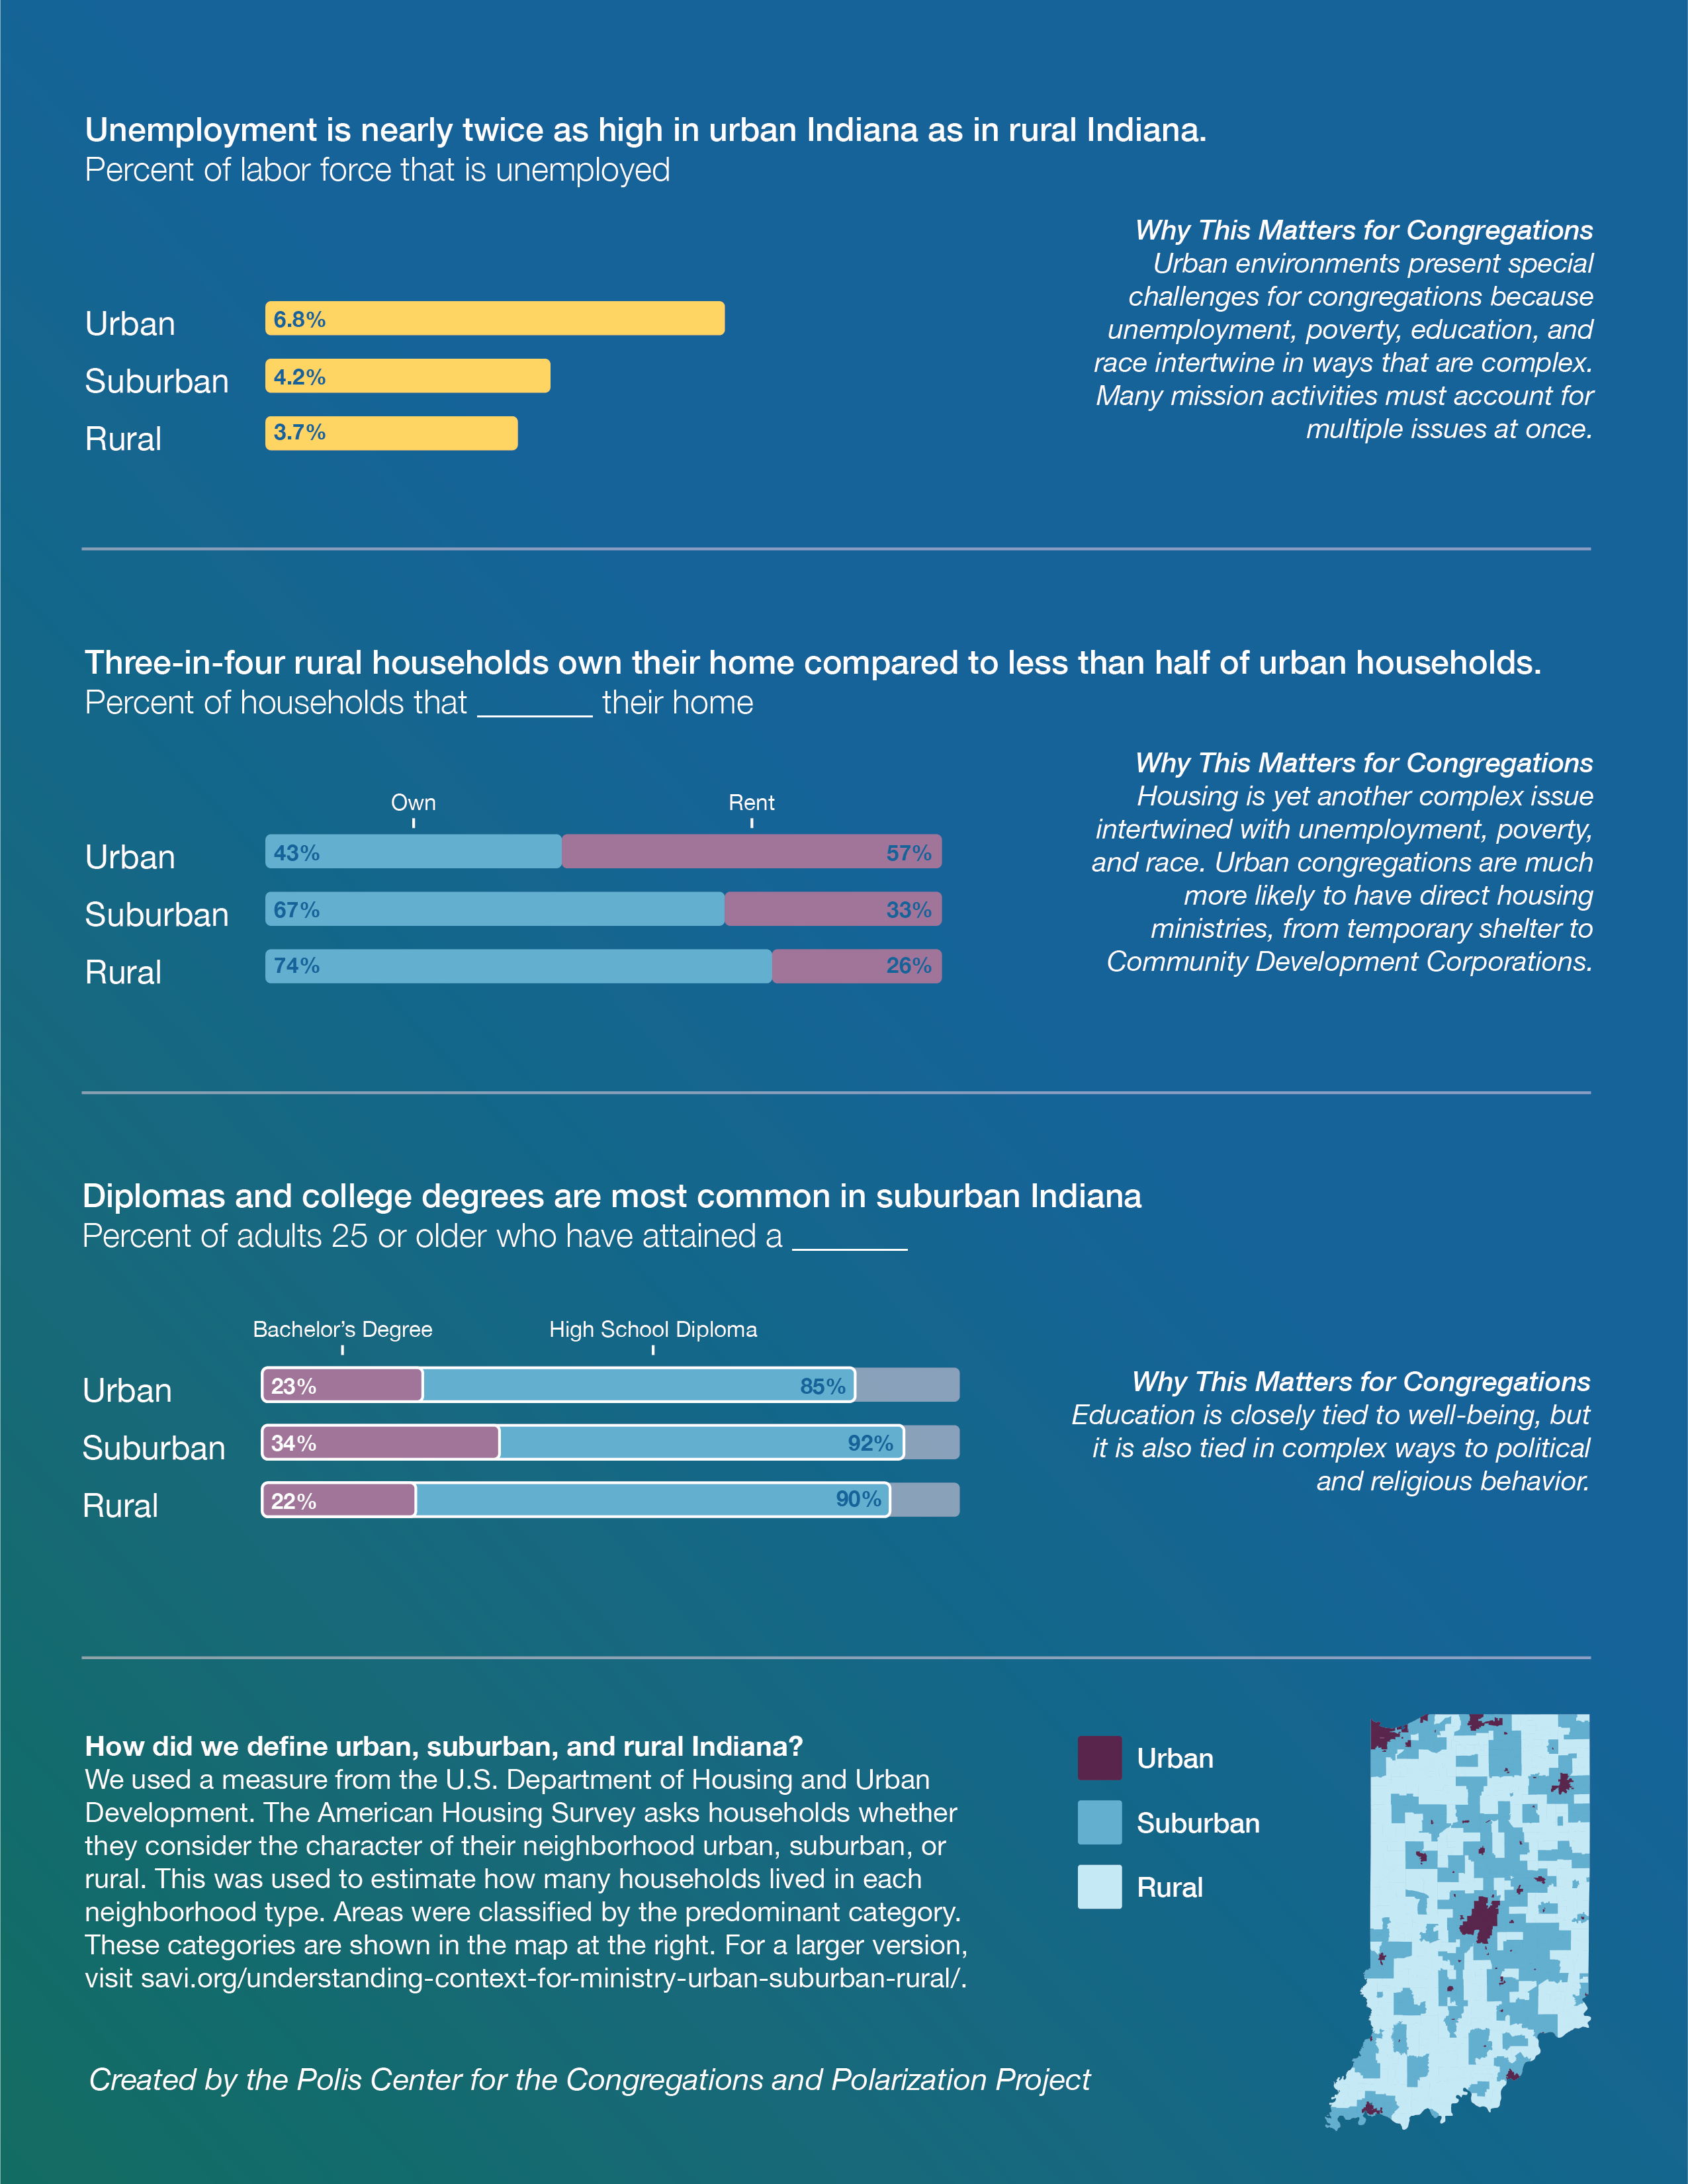
How did we define urban, suburban, and rural Indiana?
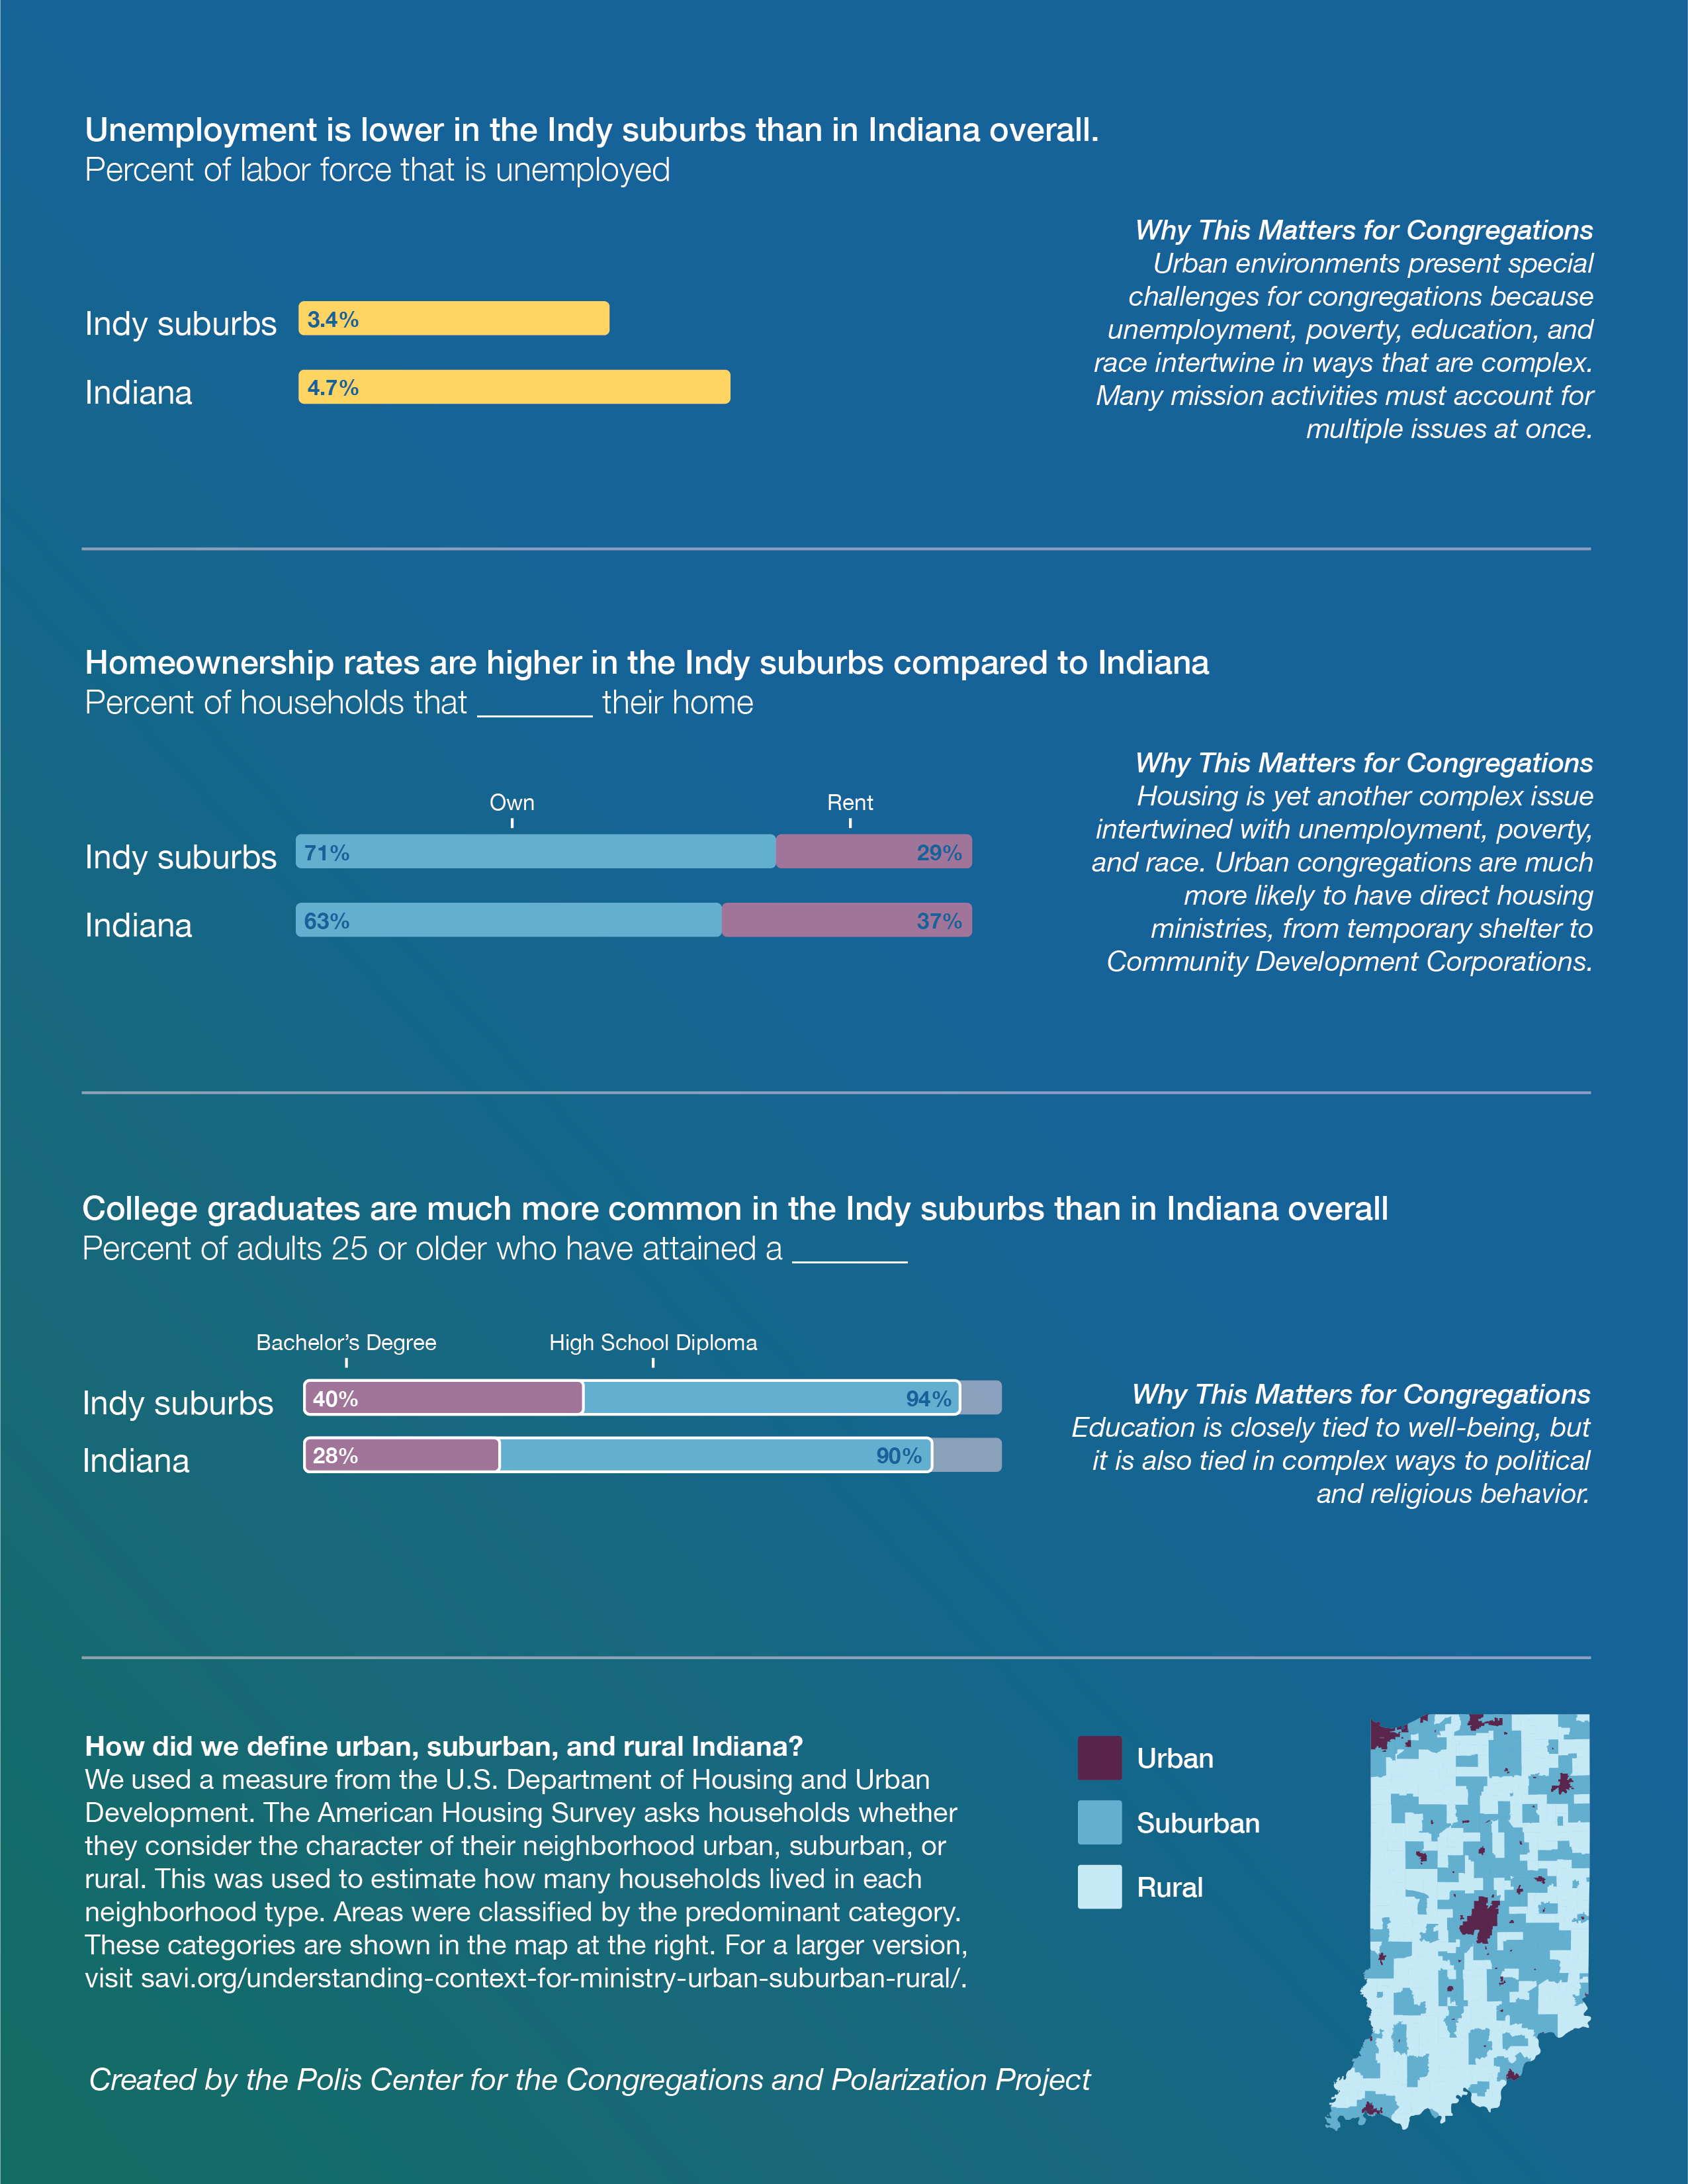
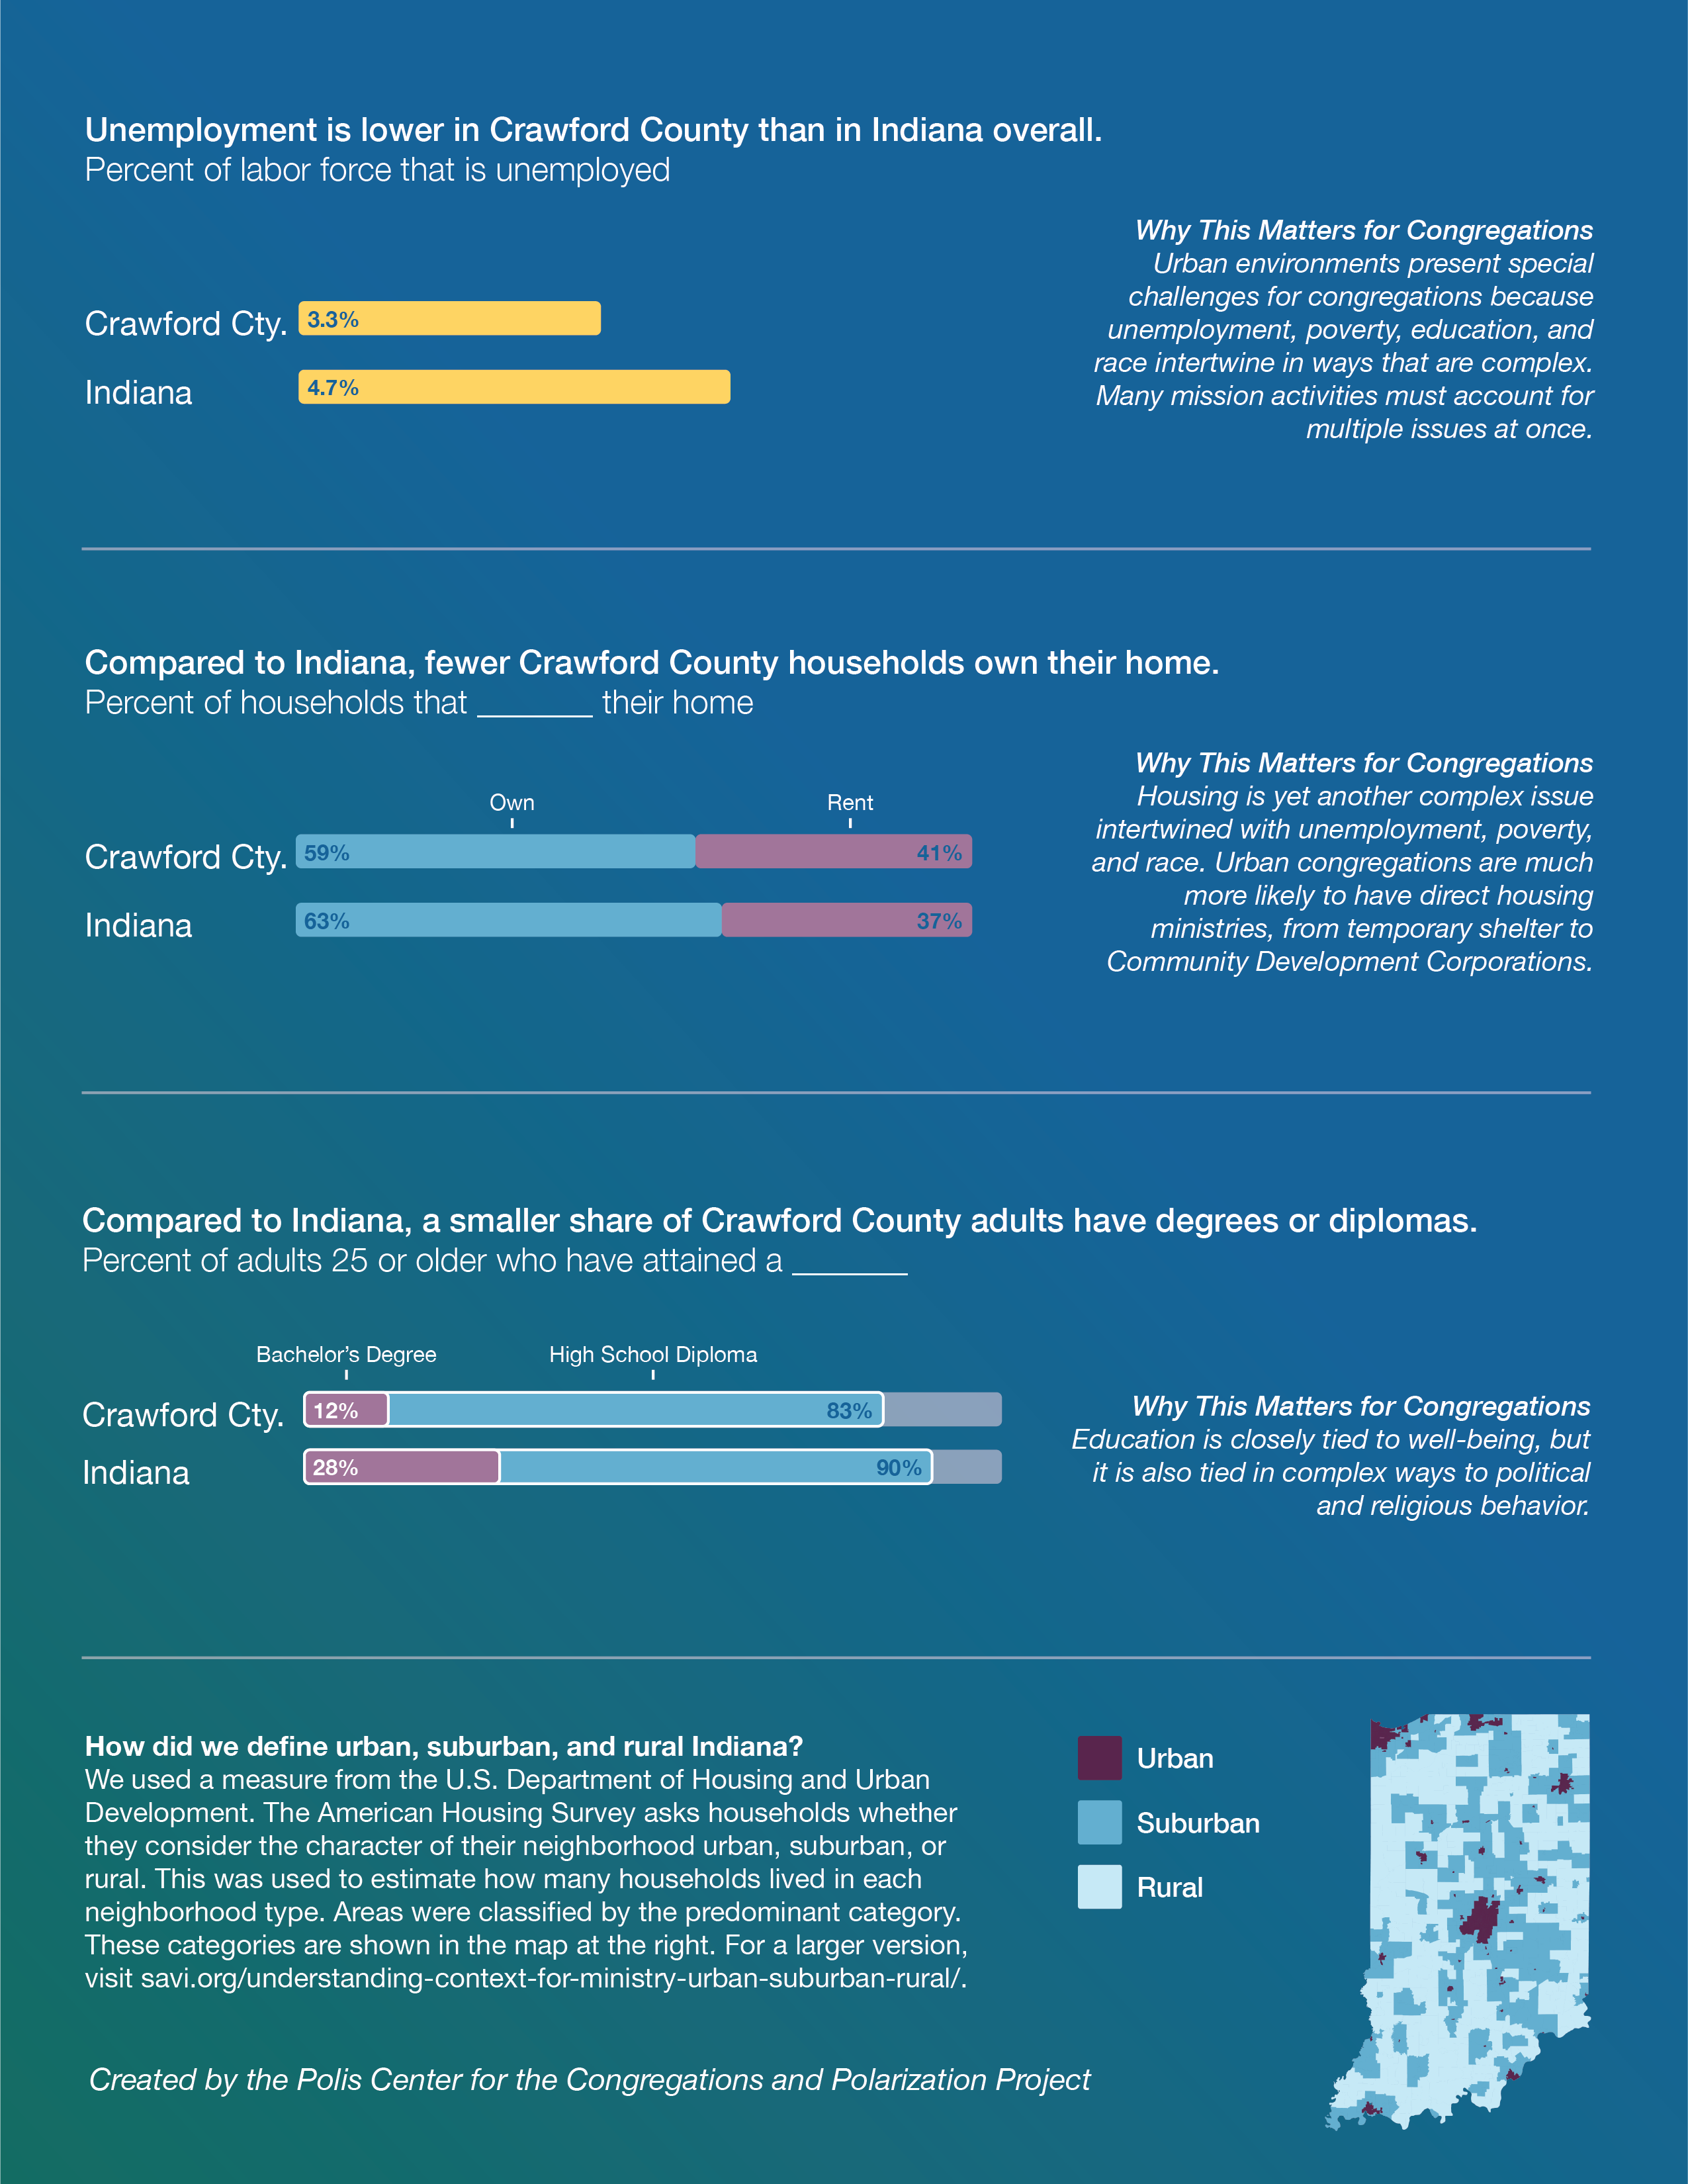
We used a measure from the U.S. Department of Housing and Urban Development. The American Housing Survey asks households whether they consider the character of their neighborhood urban, suburban, or rural. This was used to estimate how many households lived in each neighborhood type. Areas were classified by the predominant category. These categories are shown in the map above.
Did you know?
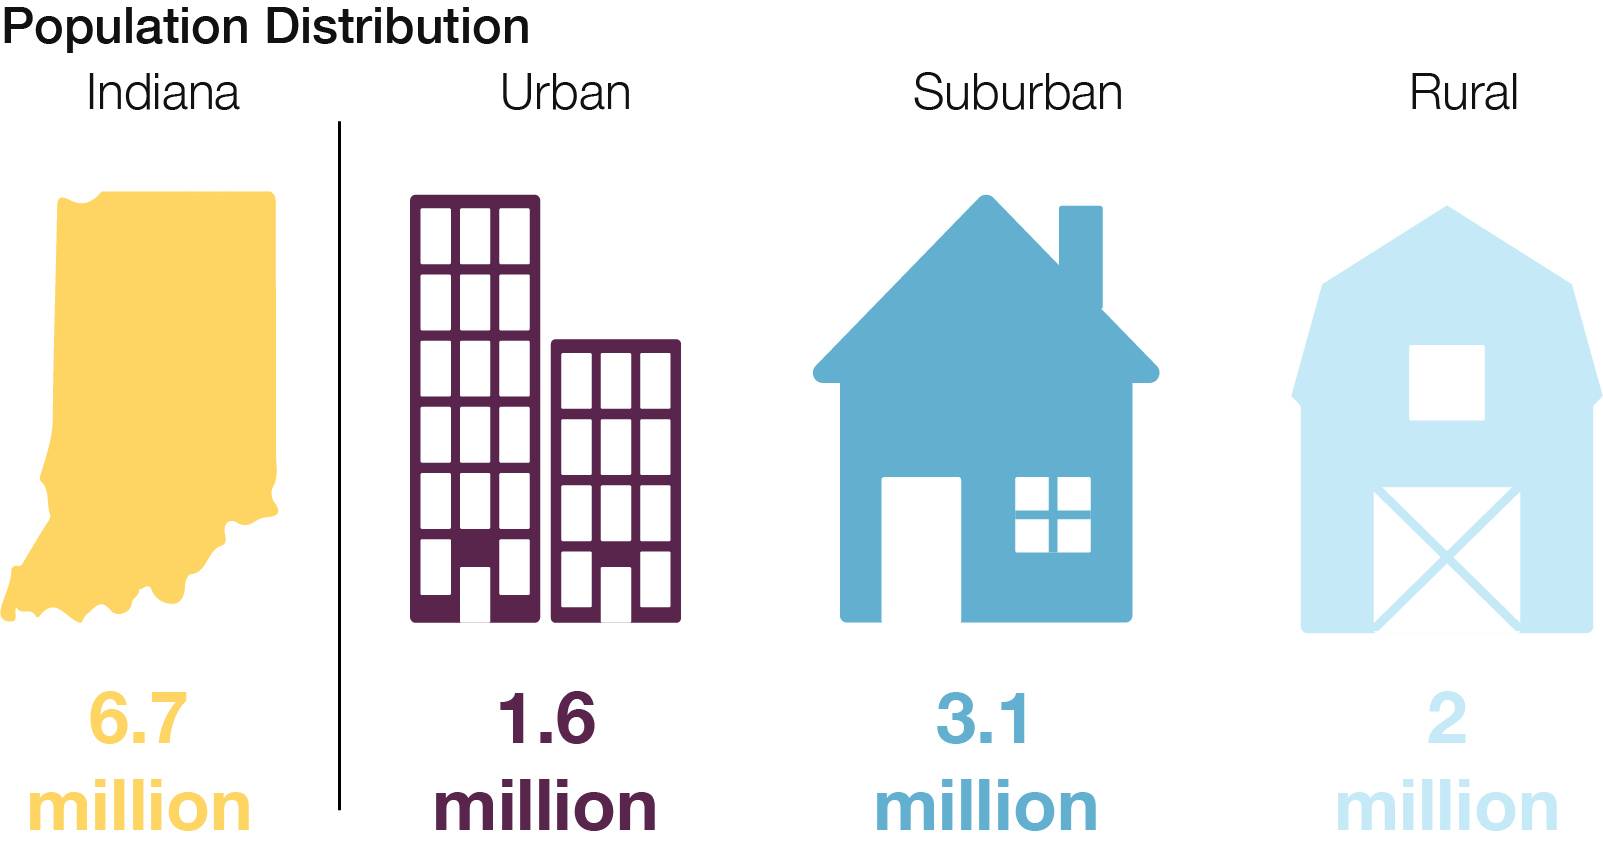
Indiana has a population of approximately 6.7 million people. Of those, 1.6 million (24%) live in urban areas, 2 million (30%) live in rural areas, and 3.1 million (46%) live in suburban areas. Although public imagination might think of Indiana as a rural state, the majority of Hoosiers describe the communities where they live as suburban, as do the majority of Americans.
Congregations and Polarization Project Study Areas
Map of urban, suburban, and rural Indiana with eight regions detailed in this report:
- Allen County
- Bartholomew and Jackson Counties
- Crawford County
- Elkhart County
- Indy MSA minus Marion
- Marion County
- Northwest Region
- Ohio and Ripley Counties
Demographic Data About the Hoosier Context
Indiana has a population of approximately 6.7 million people. Of those, 1.6 million live in urban areas, 2 million live in rural areas, and 3.1 million live in suburban areas as defined by the method noted above. Although public imagination might think of Indiana as a rural state, the majority of Hoosiers describe the communities where they live as suburban, as do the majority of Americans. On some important measures, these areas across Indiana are not as different from one another as some might guess. For instance, all three areas now have broadband internet in over 80% of homes. And in all three areas, more than 85% of adults have high school diplomas. But there are other measures by which the three are very different. We believe these differences are so significant that they may offer important insights into cultural and political differences that shape the cultural context where ministry takes place.
To be clear, none of the data in this report proves anything about the culture of these areas, but it is important information that can be set alongside other data about the political or religious makeup of these areas. This data, when linked with further data about religion and politics, provides a thick empirical context for thinking about cultural differences. Interpreting culture is an incredibly complex undertaking and reasonable people will come to different conclusions, so it is important to proceed with caution and humility. We are committed to starting this conversation about cultural context–and about the role of congregations within these contexts–using a descriptive baseline to help all future assumptions and interpretations be clearer and better-informed.
Race and Ethnicity
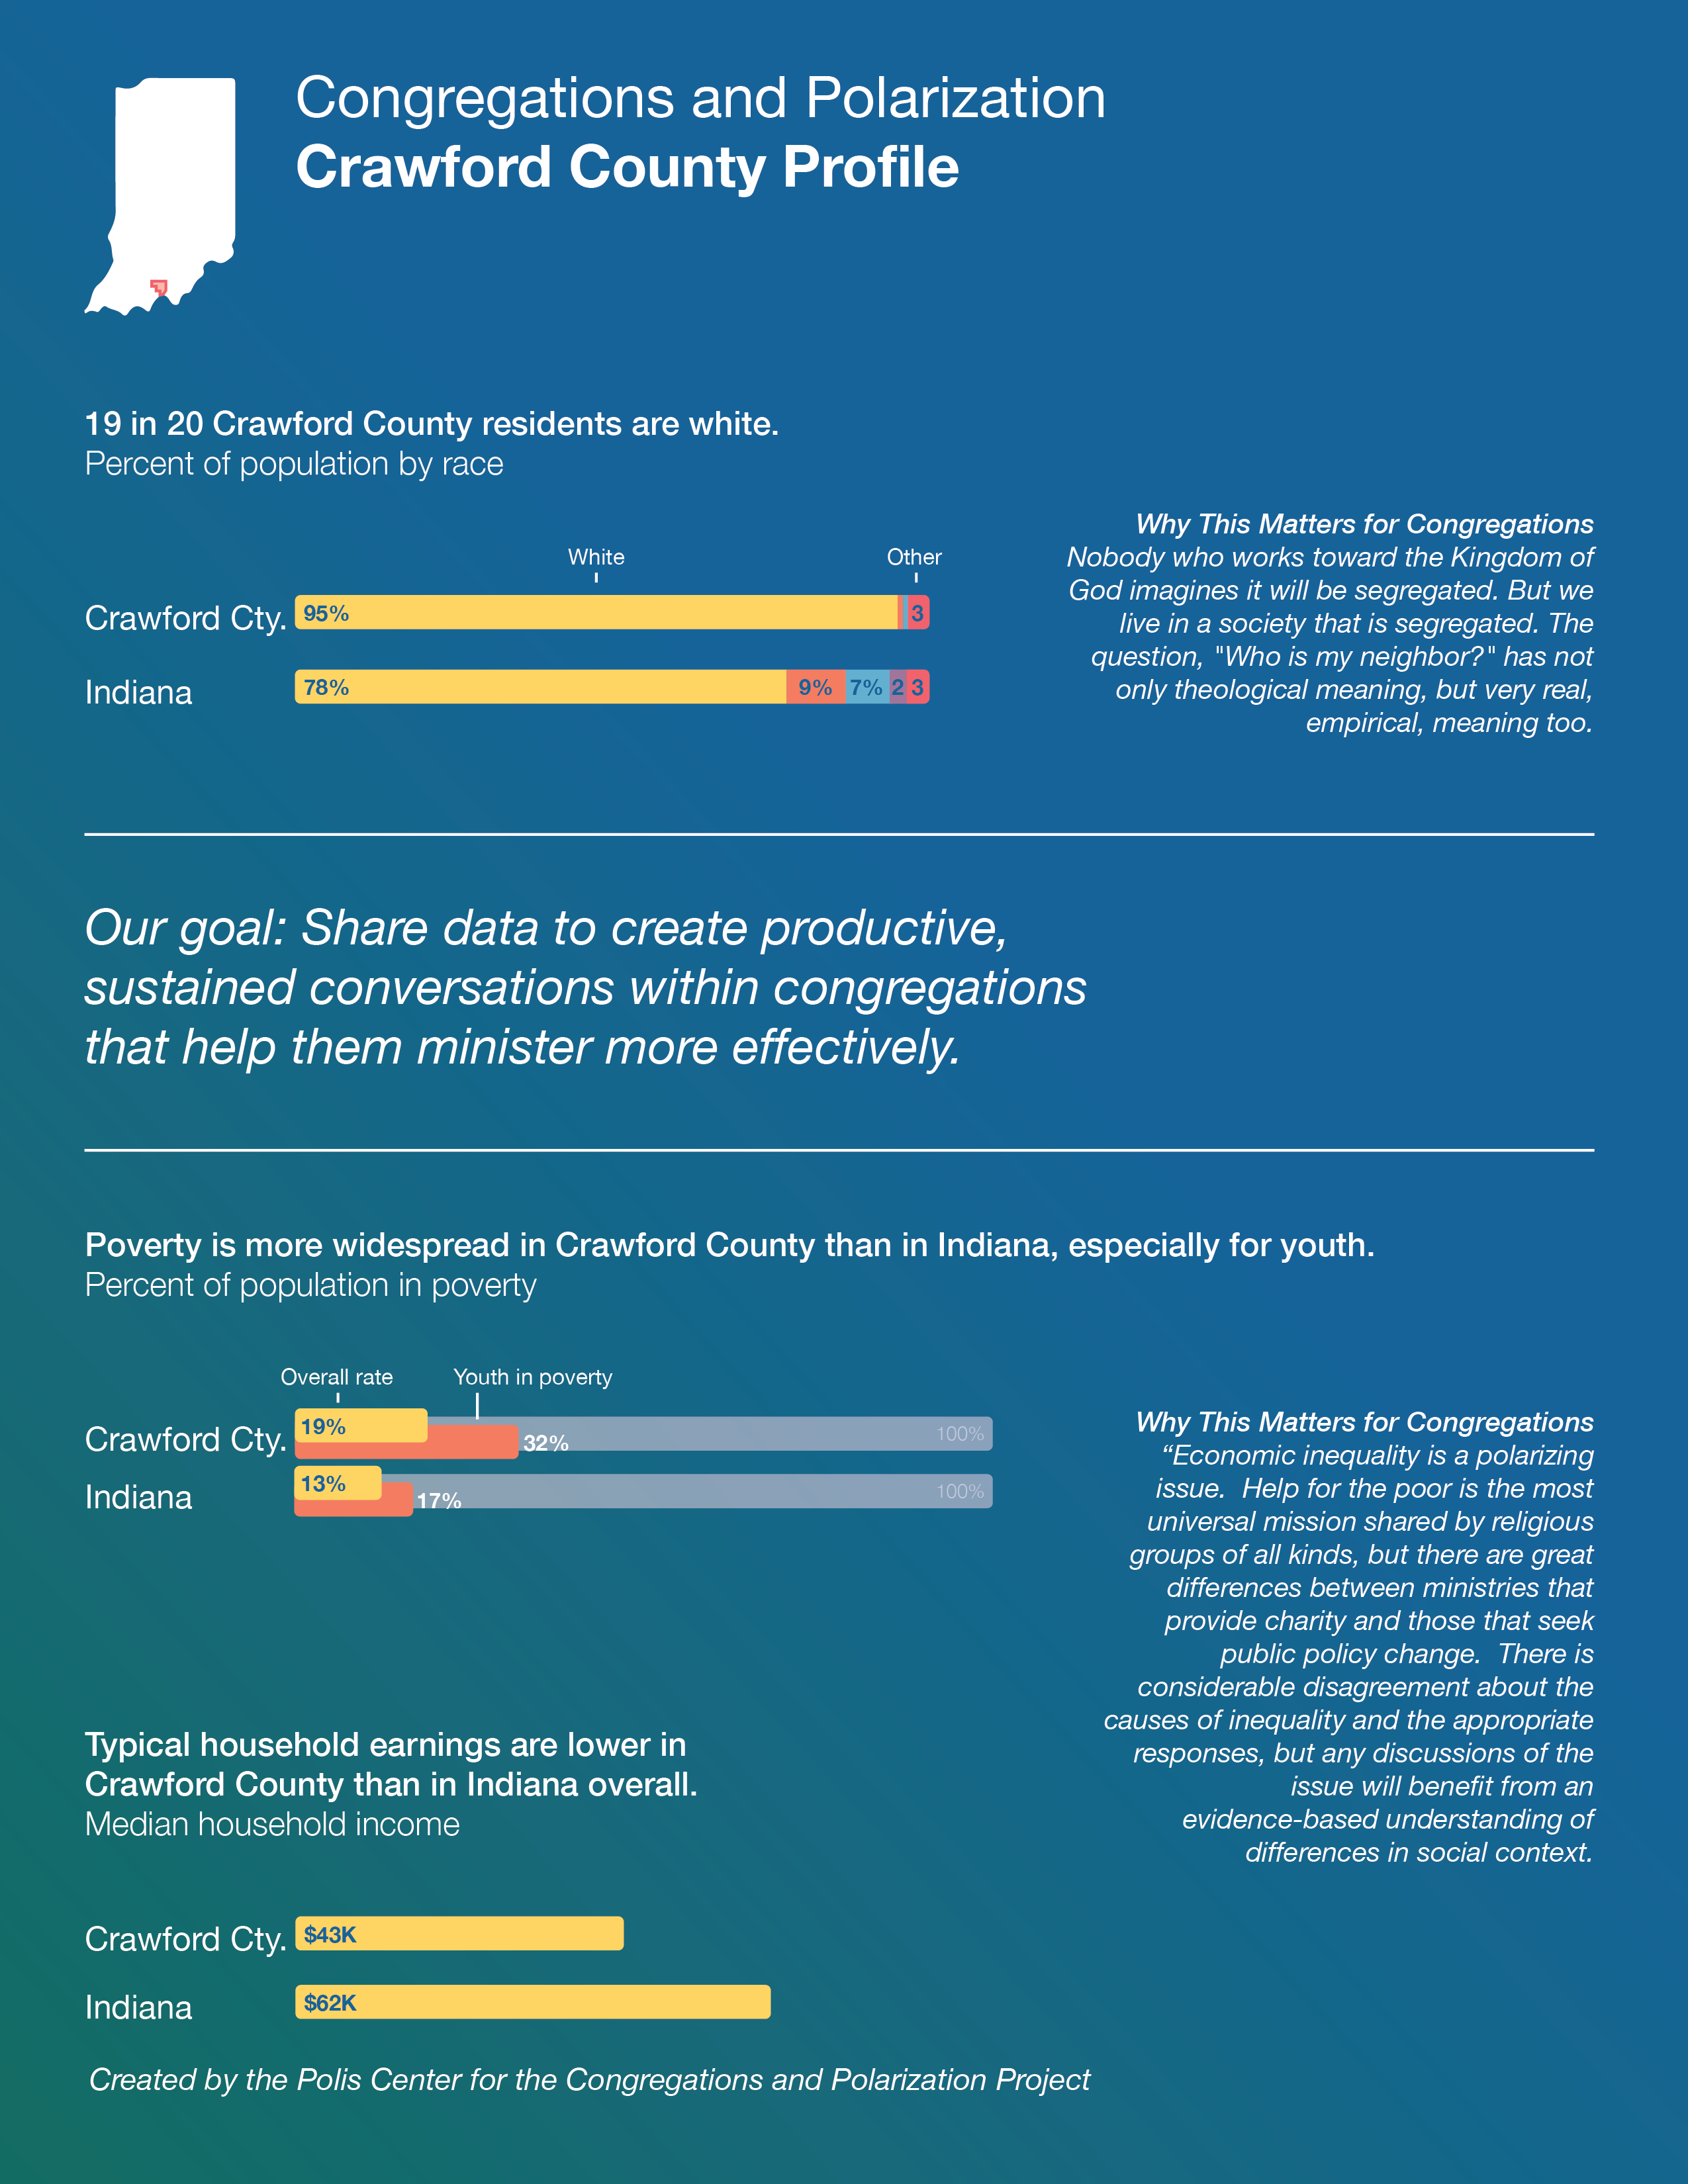
Racial discrimination remains a divisive force in American society. Our shared history of slavery as an institution makes Black/white racism a persistent source of polarization as demonstrated by the national outrage over the murder of George Floyd, the rise of the Black Lives Matter movement, and the furor surrounding critical race theory in schools. The intellectual and moral issues underlying these questions are the same for everyone no matter where they live. But as a practical matter, daily experience of racism differs considerably, and this is likely to shape cultural attitudes and assumptions. Indiana is overwhelmingly white (83%) but this is not highly unusual. Fifteen states have a higher proportion of white residents than Indiana. Indiana has a relatively low Hispanic population, so non-Hispanic whites make up 78% of the state’s population.
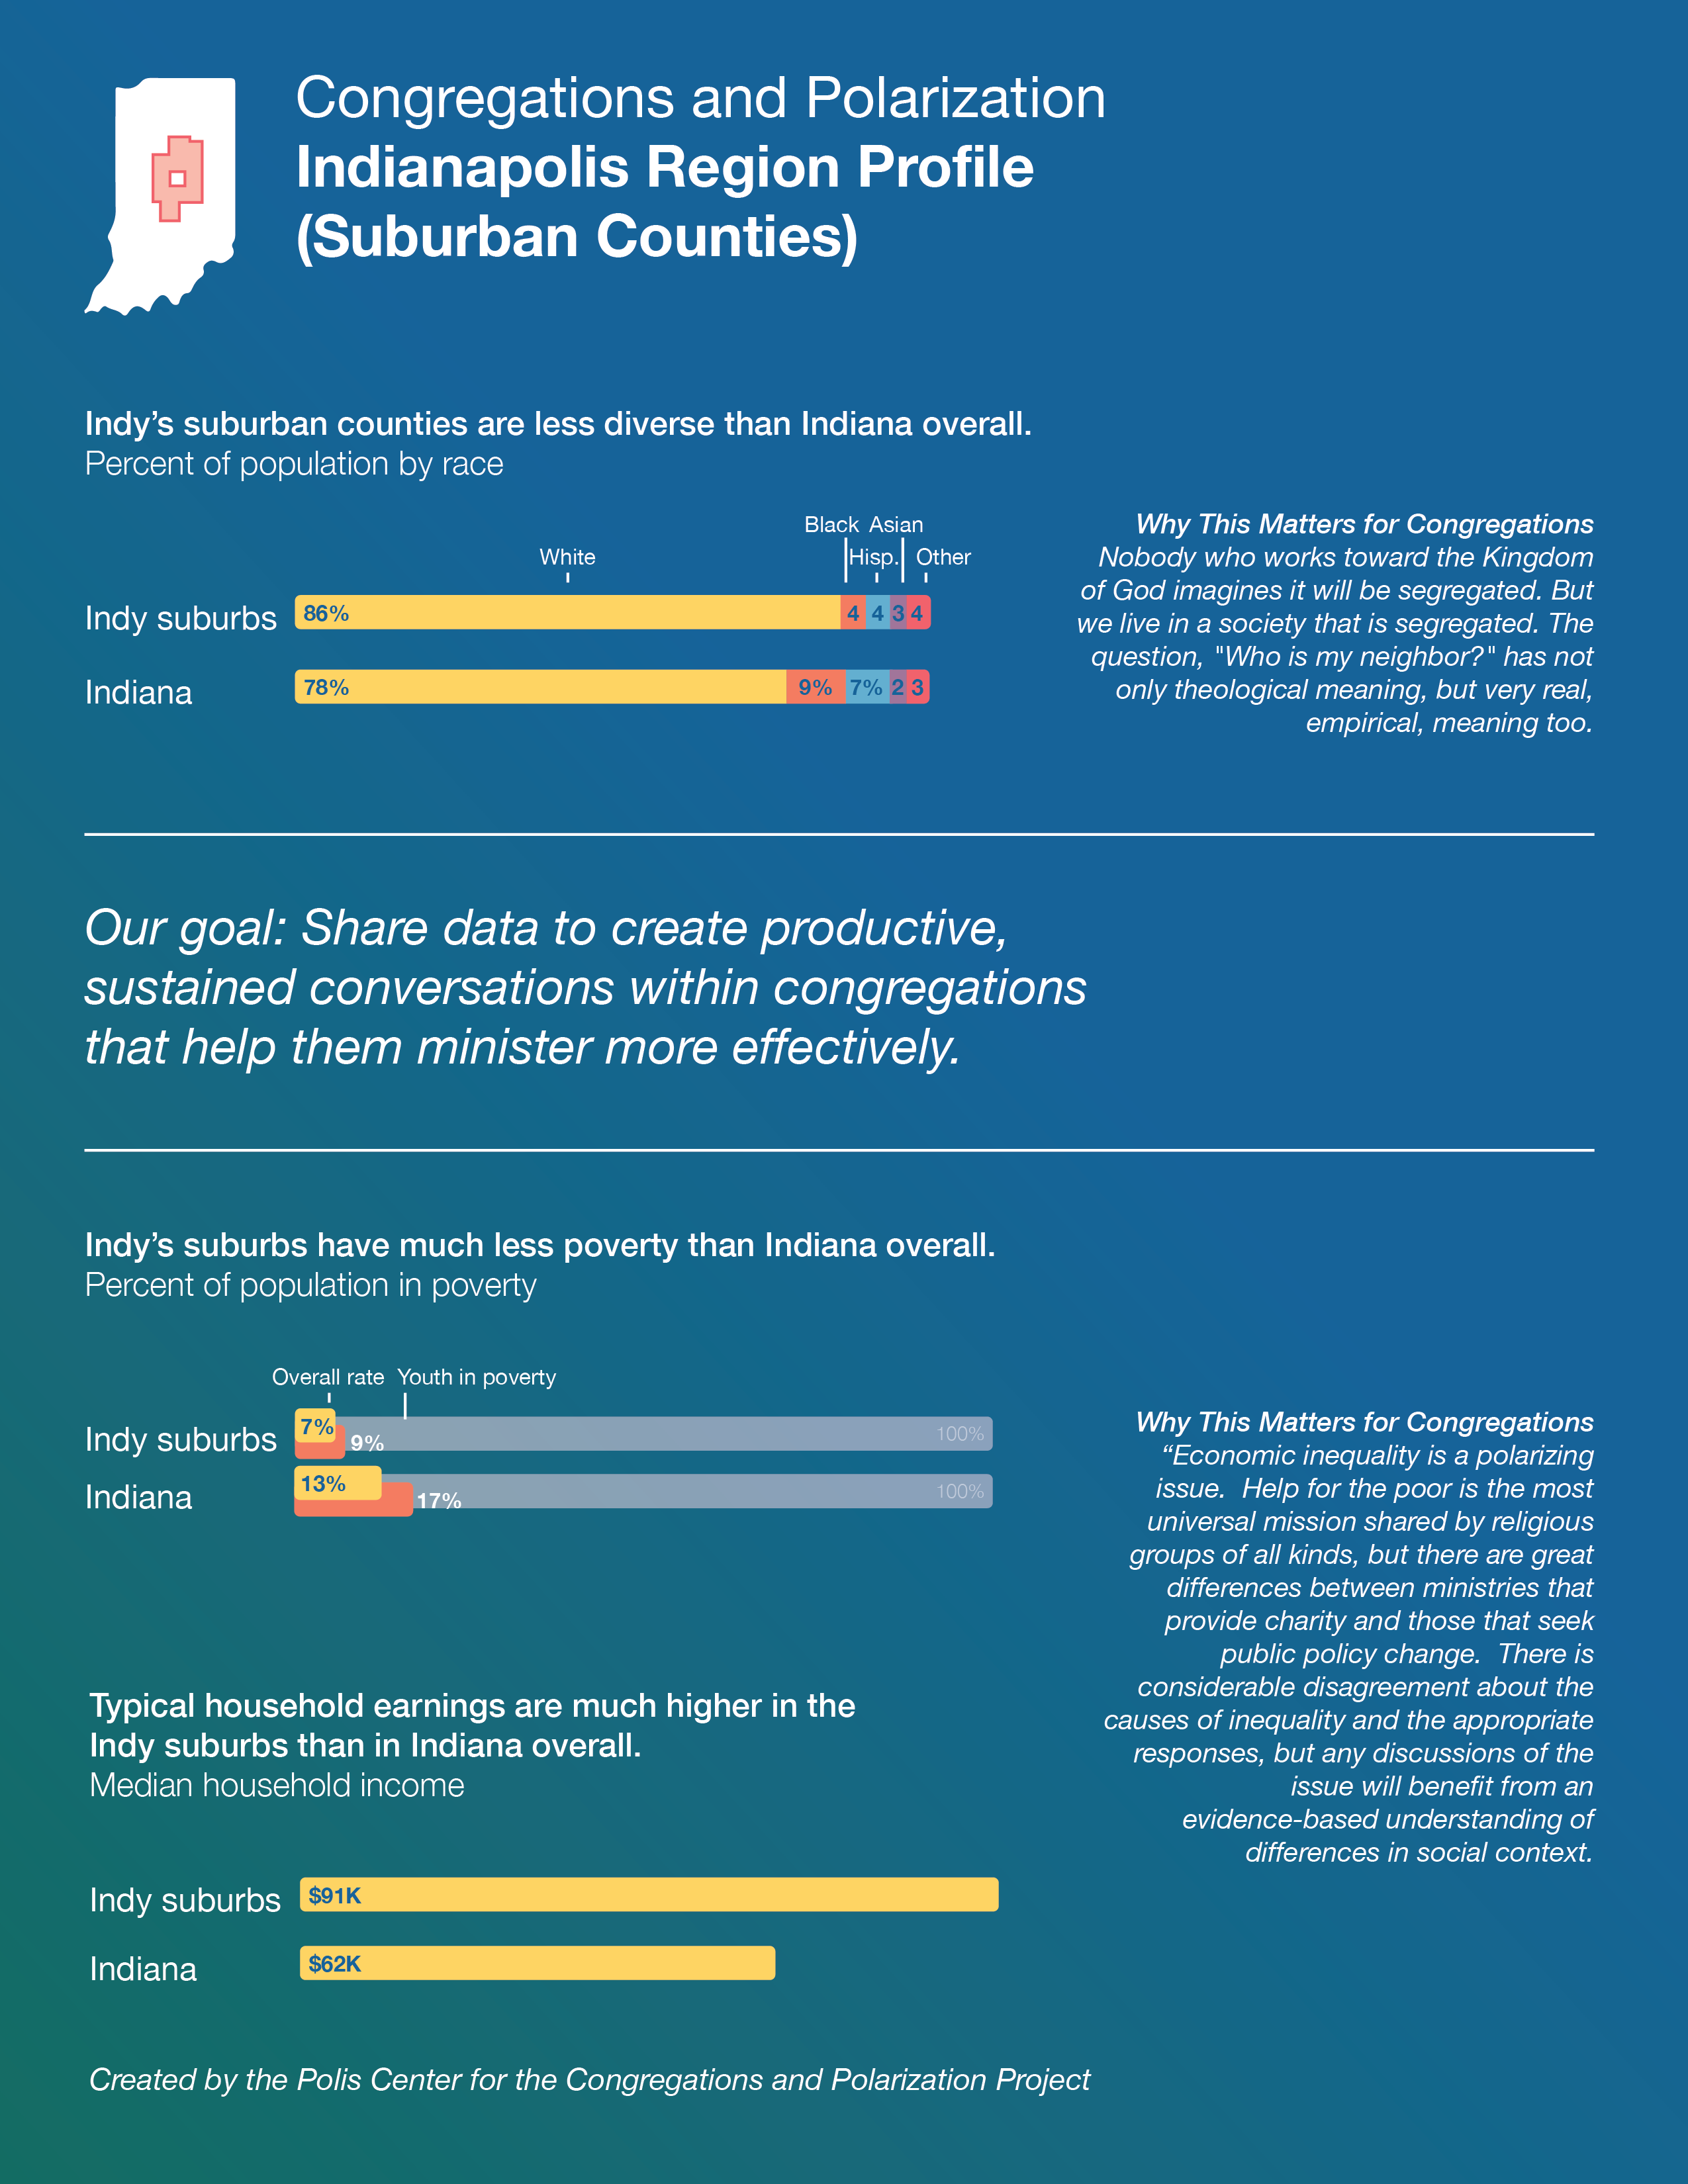
But the differences in racial makeup among urban, rural, and suburban places in Indiana are very large. In urban areas, non-Hispanic white people make up 60% of the population and Black people make up 22%. In rural areas, non-Hispanic white people make up 93% and Black people are less than 1%. White and Black people are therefore likely to encounter one another every single day in cities and unlikely to encounter one another at all in rural areas. This daily exposure, or lack thereof, surely influences cultural assumptions and political behavior to some degree. As noted above, this empirical difference alone does not prove anything about racial attitudes–or about the prevailing culture in different places–but when we look at other evidence about differences, we have to consider the social context.
Other racial and ethnic differences follow the same pattern. Roughly 12% of residents in urban areas are Hispanic, while only 3% in rural areas are. Although the Asian population of urban Indiana is relatively small overall (2.5%) it is still more than three times the percentage of Asians in rural Indiana. In short, urban Indiana is much more diverse than rural Indiana, with suburban areas coming in somewhere in between. These differences will not surprise anyone, but the scale of difference is likely larger than most people realize.
A closer look at metropolitan Indianapolis makes this point very straightforwardly. In Marion County, the Black population is 28%. In the rest of the metropolitan area minus Marion County, it is 4%. Conversely, the non-Hispanic white population of Marion County is 53%, while the metro area without Marion County is 86%. Whether we are looking at the quality of schools, homeownership and housing patterns, voting patterns, or the kinds of religious organizations present, these differences play an important role.

Why This Context Matters for Congregations
In all of our studies of congregations through the decades, not a single congregation has said to us that racial separation should be the goal. Not a single one has ever said God’s love was only for people of one race or ethnic group. Never. Almost no one, literally, who expects the Kingdom of God imagines it will be segregated.
But we live in a society that is segregated. The question, “Who is my neighbor?,” has not only symbolic, theological meaning, but very real, empirical, meaning too. On the question of race, for instance, African-Americans are acutely aware of the role the historic Black Church plays in their lives. African-Americans have long had leadership opportunities in the Black Church, including political opportunities, that would not otherwise be available. In a society full of immigrants, congregations sometimes work in languages other than English. Integration is a worthy ideal, in a stable environment, but many congregations have tried to integrate across different racial or ethnic lines only to find that expectations for crucial, cultural elements such as preaching and music differ so widely that unity is extremely difficult. And preaching and music are the easy part; expectations about the meaning of Biblical authority or the demands of social justice differ even more.
This study does not want to assume too much about what “rural churches” or “urban churches” or “Black churches” are like. We do not want to pretend that we always know where they stand or what ministries they provide. At the same time, we see examples of ministries where Black and white congregations attempt to meet together, where racial justice becomes an overriding theme, where pulpits are offered or assigned in an effort to bridge existing racial or ethnic gaps, and we know that this cannot be the same in rural Indiana, where nearly everyone is non-Hispanic white, and urban Indiana, where close to half the population is not.
Ministry must meet the needs of the people in the context where it operates. As we said earlier, our underlying goal in presenting this data is to create productive, sustained conversations within congregations that help them minister more effectively in their given context.
Income and Poverty
Economic inequality, specifically the narrative around poverty, drives much of the social, political, and cultural polarization in America, and here, the differences among the three areas of Indiana are stark. In urban areas, 17% of families live in poverty. In rural and suburban areas, this figure is 6–7%. The same figures—17% urban vs. 6–7% elsewhere—apply for families receiving some kind of cash assistance (SNAP). If one looks at the total population living in poverty, as opposed to family units, the figures are 22% in urban areas compared to 9% in the suburbs or rural areas. Per capita income is roughly $25,000 in cities compared to $33,000 in rural areas and $37,000 in suburban ones. Median household income differences are clearer: $76,000 in the suburbs, $71,000 in rural areas, and $45,000 in cities. In short, average income is lower in urban areas and poverty is much higher.
But these cumulative differences do not tell the whole story. A closer look at our eight study areas provides some important nuance. Crawford County, a rural area of only 10,000 residents, is much poorer than any urban area we designated. Crawford has the highest percentage of households on public assistance, the highest (by far) living in poverty, the highest (by far) of youth in poverty, and the lowest income whether measured by household or per capita. The upshot is that cities have higher percentages of poverty, but they also have pockets of wealth that drive up averages.
This is where such comparisons get especially tricky. We could choose an Indianapolis neighborhood of 10,000 residents that is certainly as poor as Crawford County. But that neighborhood would still be near resources that are unavailable in rural areas. For example, some rural counties, especially in southern Indiana, have few major employers and not even many prosperous farms. The takeaway here is that poverty cannot be described as simply urban or rural because it is related to many other specific historical and structural factors. Our goal is to spur clearer thinking about specific contexts and the implications those contexts have for congregations.


Why This Context Matters for Congregations
A very large majority of congregations have ministries aimed at helping the needy. Previous research has shown this to be the single outreach program shared by the largest number of religious organizations. But the range of such ministries is incredibly broad. Many congregations have small food or clothing pantries filling holes in the social safety net. Others lobby for change in government policies and public assistance, seeking to make systemic change rather than, or often in addition to, offering individual assistance. Some offer temporary shelter for people experiencing homelessness. Others run Community Development Corporations with the intention of changing the patterns of housing in their neighborhoods.
Congregations offer stop-gap assistance to people facing hard times and America is surely a better place because they do. They are, and always have been, a supplemental safety net. But the culturally and politically polarizing issues stem from a very different set of questions: Who in my community is poor? Why are they poor? What resources are available to help them? How does my religious community fit into this? The variables involved are complex: employment, wages, housing costs, discrimination (historical or current), public policy, bureaucracy, and education, to name a few.
Economic inequality is a polarizing issue in America. Help for the poor is the most universal mission shared by religious groups of all kinds. Evidence-based conversations about inequality, poverty, and strategies for helping are the best way to make these ministries more effective.
Complex Contexts
The differences in race and income stand out in the data, but there are other meaningful differences among urban, rural, and suburban areas that are critical for understanding the social contexts in which congregations operate. Education is closely tied to economic well-being, but it is also tied in complex ways to political and religious behavior. The percentage of residents with a high school diploma or equivalent is relatively close among the three. In urban areas, 85% of adults have diplomas or equivalent, while 90% of rural and 92% of suburban residents do. When it comes to college education, rural and urban areas have nearly identical achievement levels: 22% of rural residents and 23% of urban residents have bachelor’s degrees. The big difference here comes in suburban areas, where 34% of residents have bachelor’s degrees.
Unemployment is nearly twice as high in urban areas as in rural ones, 6.8% versus 3.7%, even though it may seem like employment opportunities are plentiful in cities. More than 11% of urban households do not have a vehicle, but only 4% of rural or suburban households do not; however, public transportation and rideshare services are more readily available in urban areas, making it more possible to get around without a vehicle. Only 18% of rural households spend 30% or more of their income on housing, but a full third of urban households do. Furthermore, although household and per capita incomes in rural areas are lower than in suburban areas, housing cost burden in rural areas is lower. When it comes to homeownership, fully three-quarters of rural households own the homes they live in while well less than half of urban households do. More than 10% of urban households lack health insurance. That figure is closer to 6% in suburban areas.


Why This Context Matters for Congregations
To unwind the complex variables involved in education, housing, vehicle ownership, or health insurance, this brief data analysis would have to become a book, or maybe several books. Our goal, however, is not to create a definitive description of every circumstance, but to point out how different the social contexts for ministry can be because of the many variables involved. These demographic variables are not the only ones that matter, but they help to create a baseline.
One of our project’s goals is to tell stories of real congregations dealing with cultural and political polarization in their local environments. But simply collecting stories and retelling them is not enough. We mean to set those stories in a larger context. Each story is important and will have unique elements, but we are looking for patterns, for connections to context, that will help congregations think more constructively about their own situation, their own similarities and differences. This is the information congregations need to minister more effectively.
Over the next two years, our project will highlight other contextual differences among our study areas. For instance, future analysis will focus on voting patterns in our study areas and on the kinds of congregations found there and the numbers of people who are members in them. We plan to provide many case studies, to tell the stories of real congregations as they do their work, but we will always make sure those stories are set in the complex, often difficult, environment where ministry actually takes place.
Closing Remarks
Future reports will discuss voting behavior and religious attendance in each of the eight areas of Indiana designated in this report. The CAP project has also created focus groups of pastors in the study areas. Discussion and analysis in these focus groups will lead to research reports and case studies about the ways congregations are adjusting their ministries to these social realities.
The CAP project thanks Polis at IU Indianapolis for their work in creating both the data and the graphic illustrations. Thanks especially to Marc McAleavy, Jay Colbert, Asger Ali, and Alli Kraus. Thanks also to Matt Nowlin. The senior team of the CAP project includes Abbey Chambers, Jason Lantzer, and Libby Manning. As always, thank you to Lilly Endowment who provided generous financial support but is not responsible for the content or analysis.
Source
SAVI analysis of 2021 ACS 5-YR Survey
Regional Infographics
Indiana
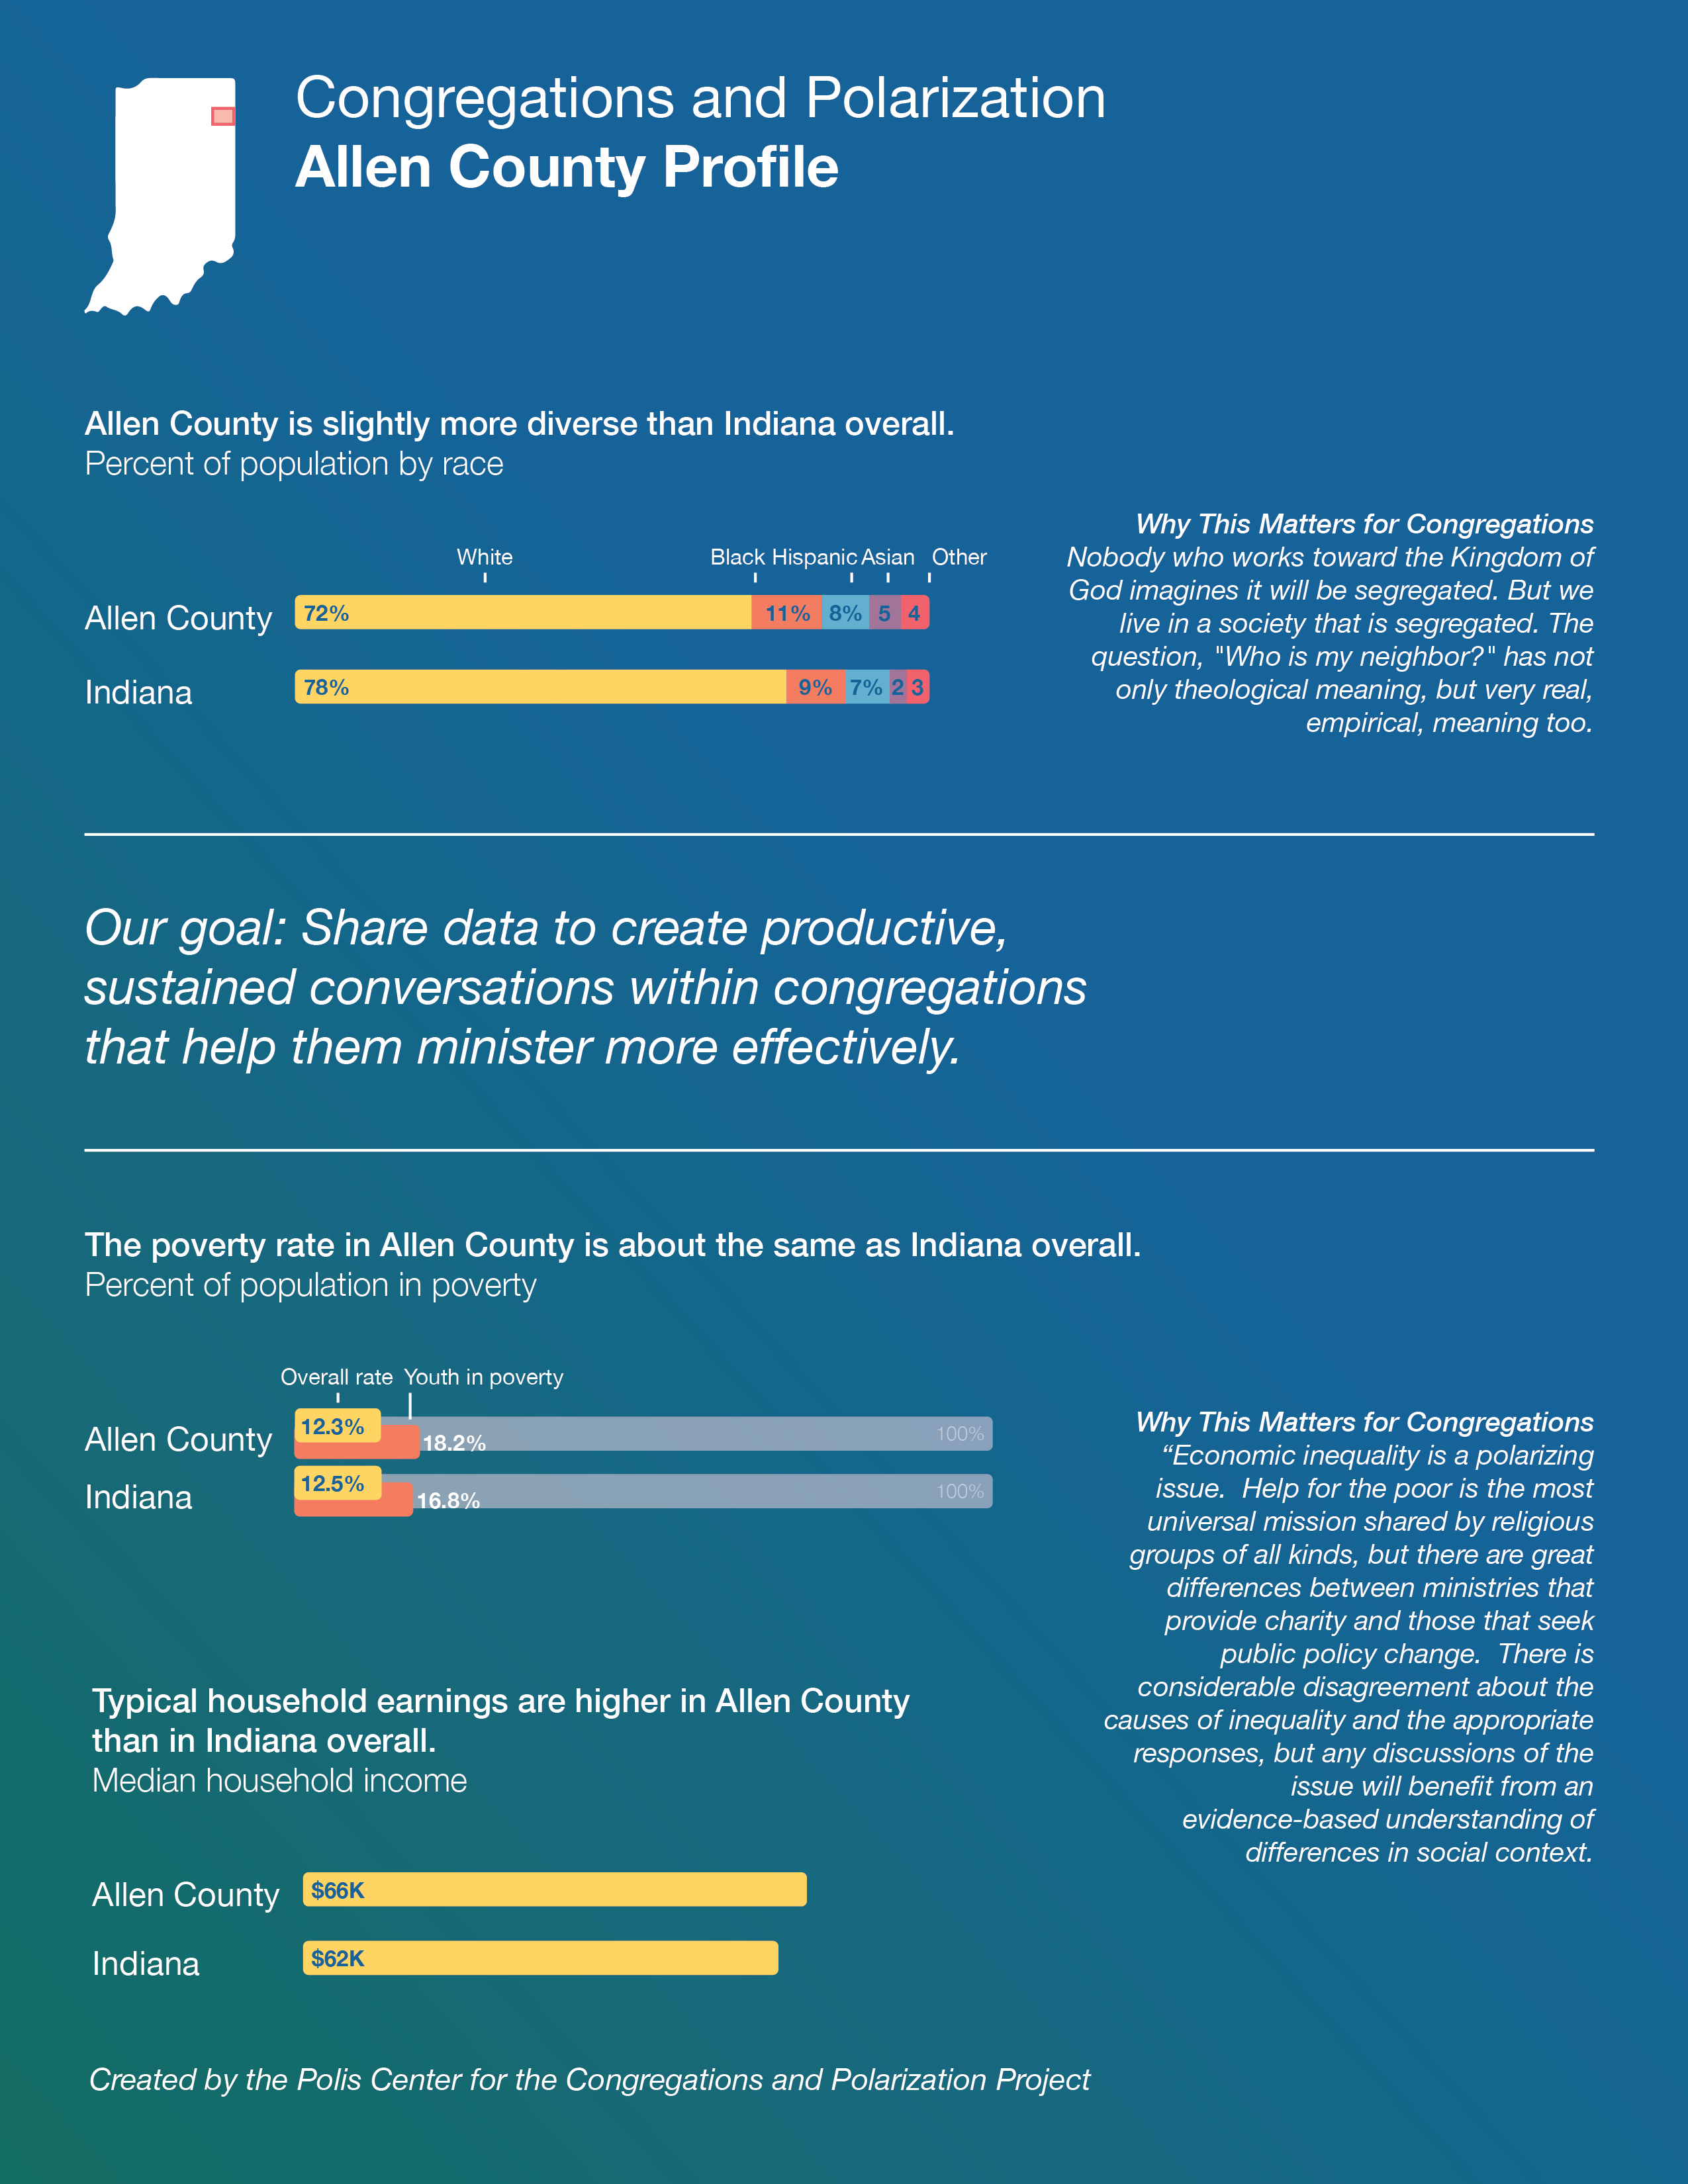
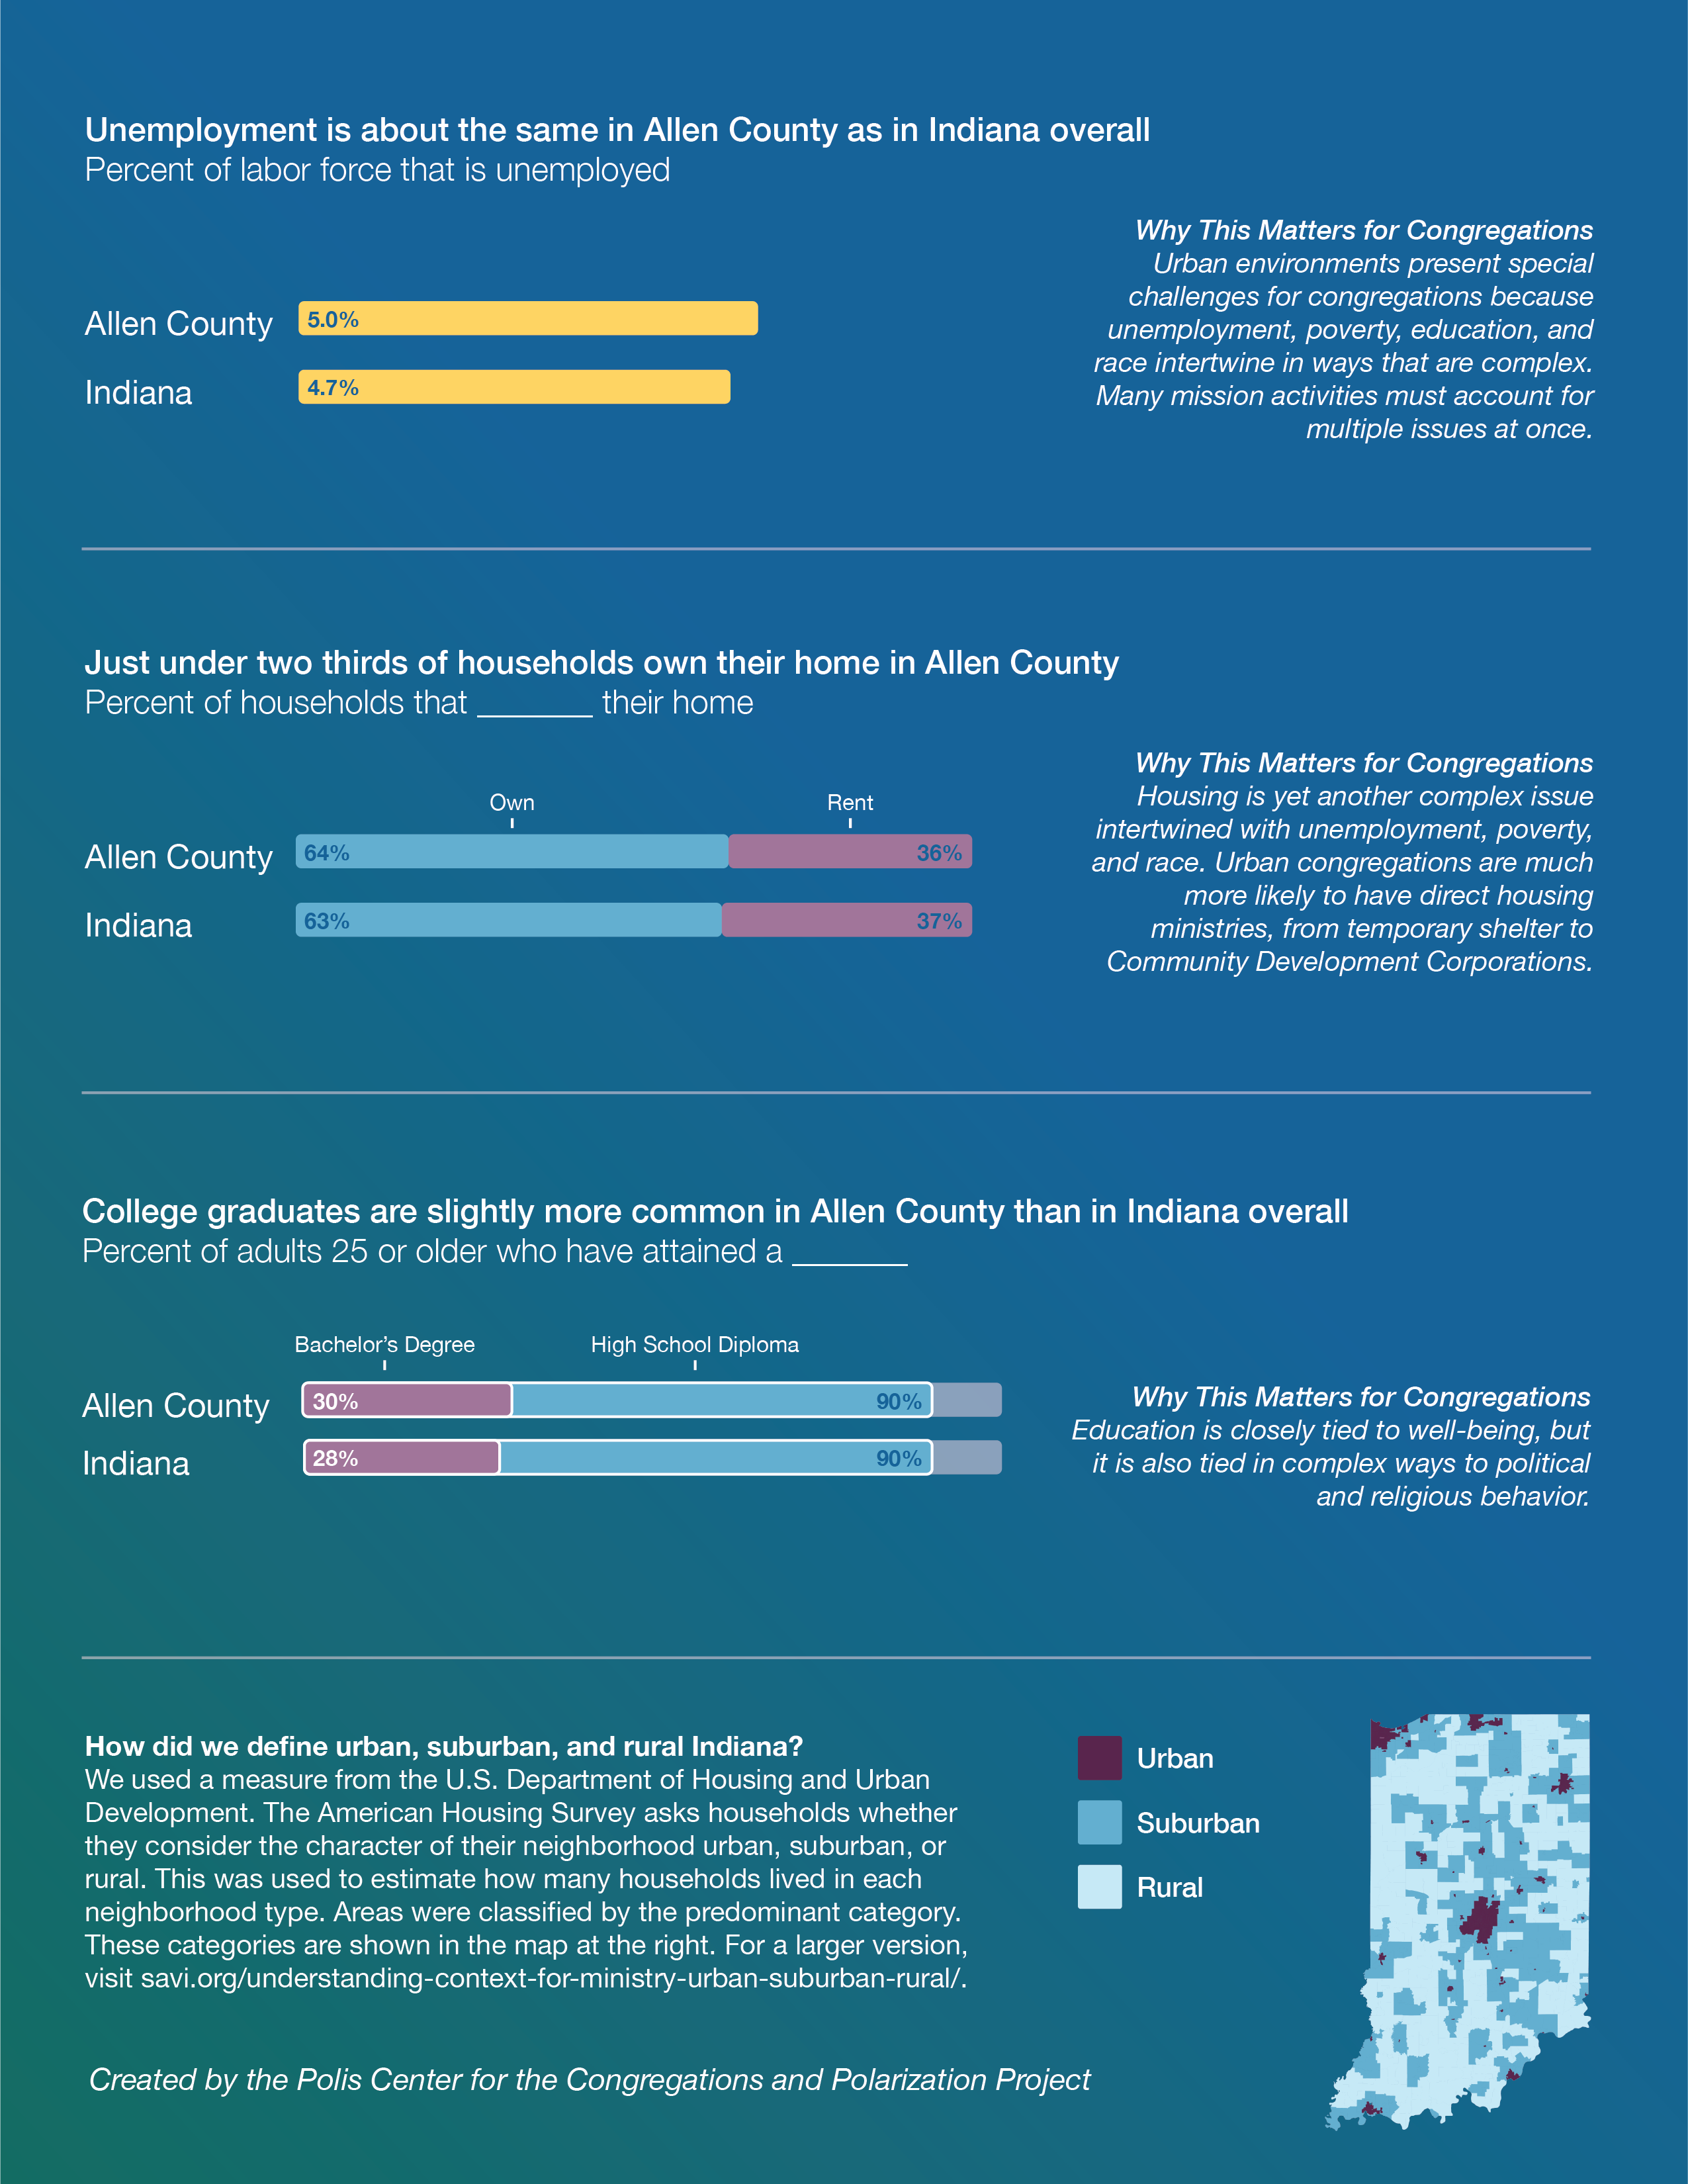
Allen County
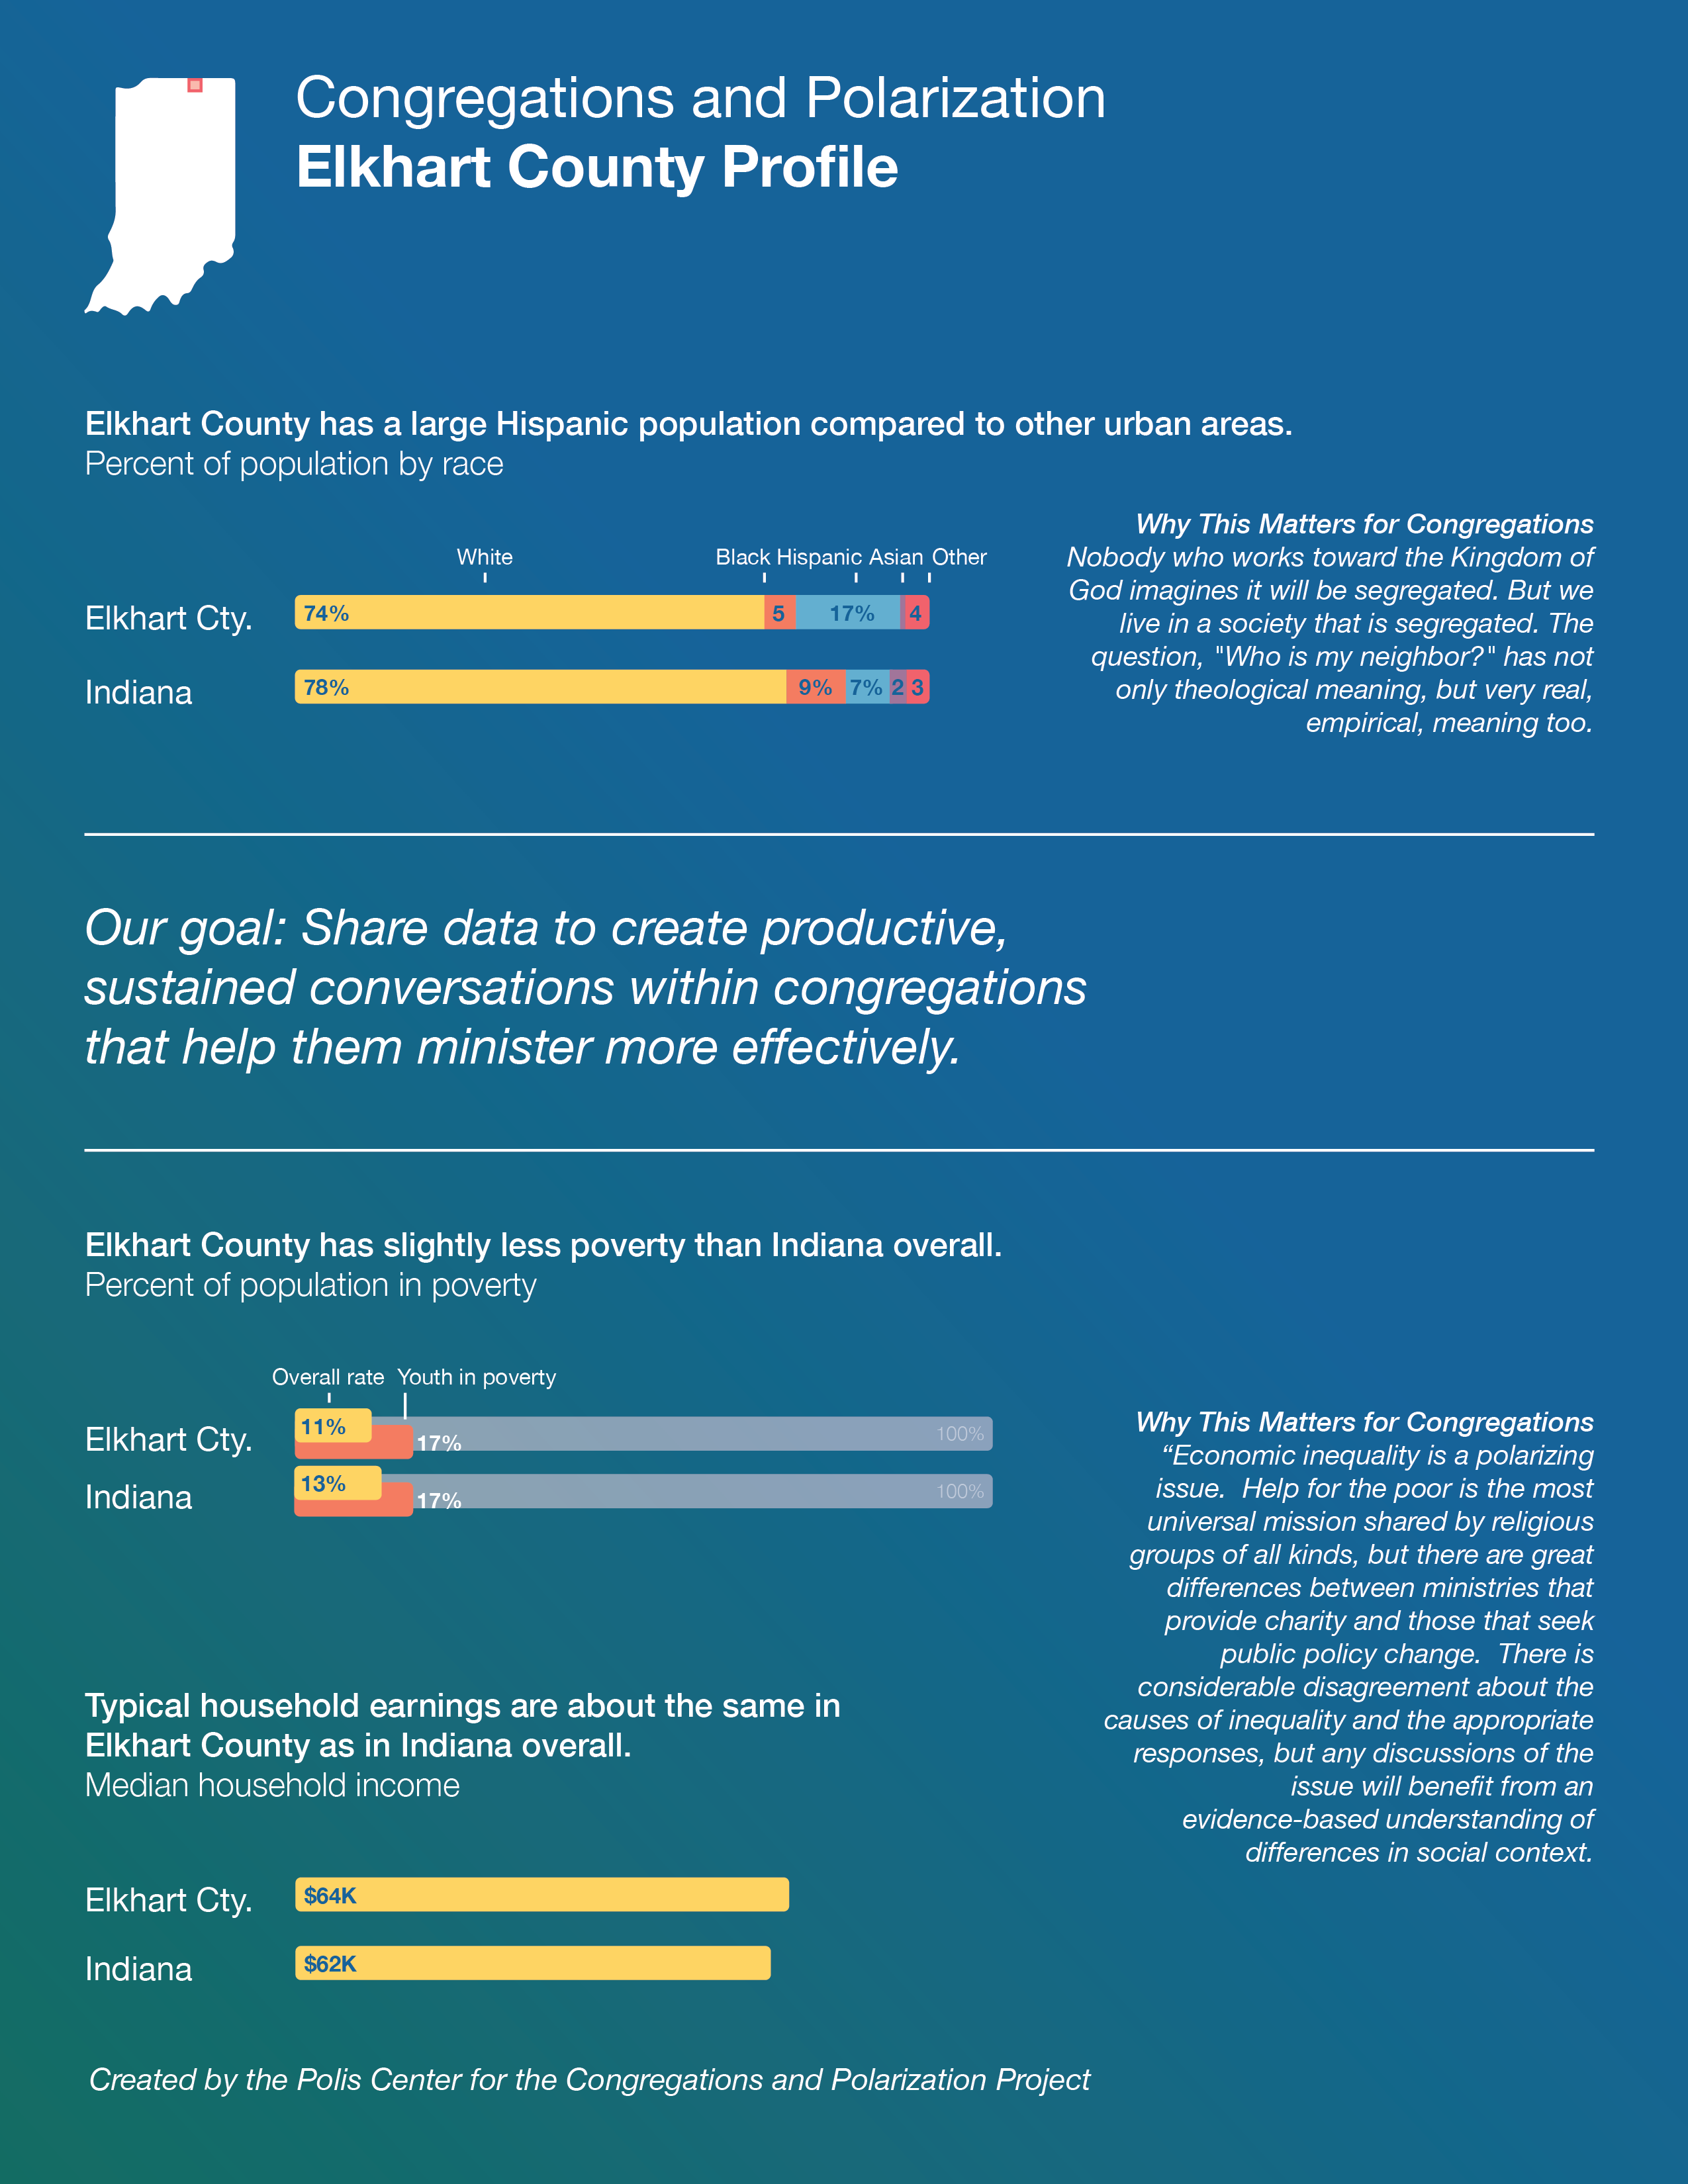
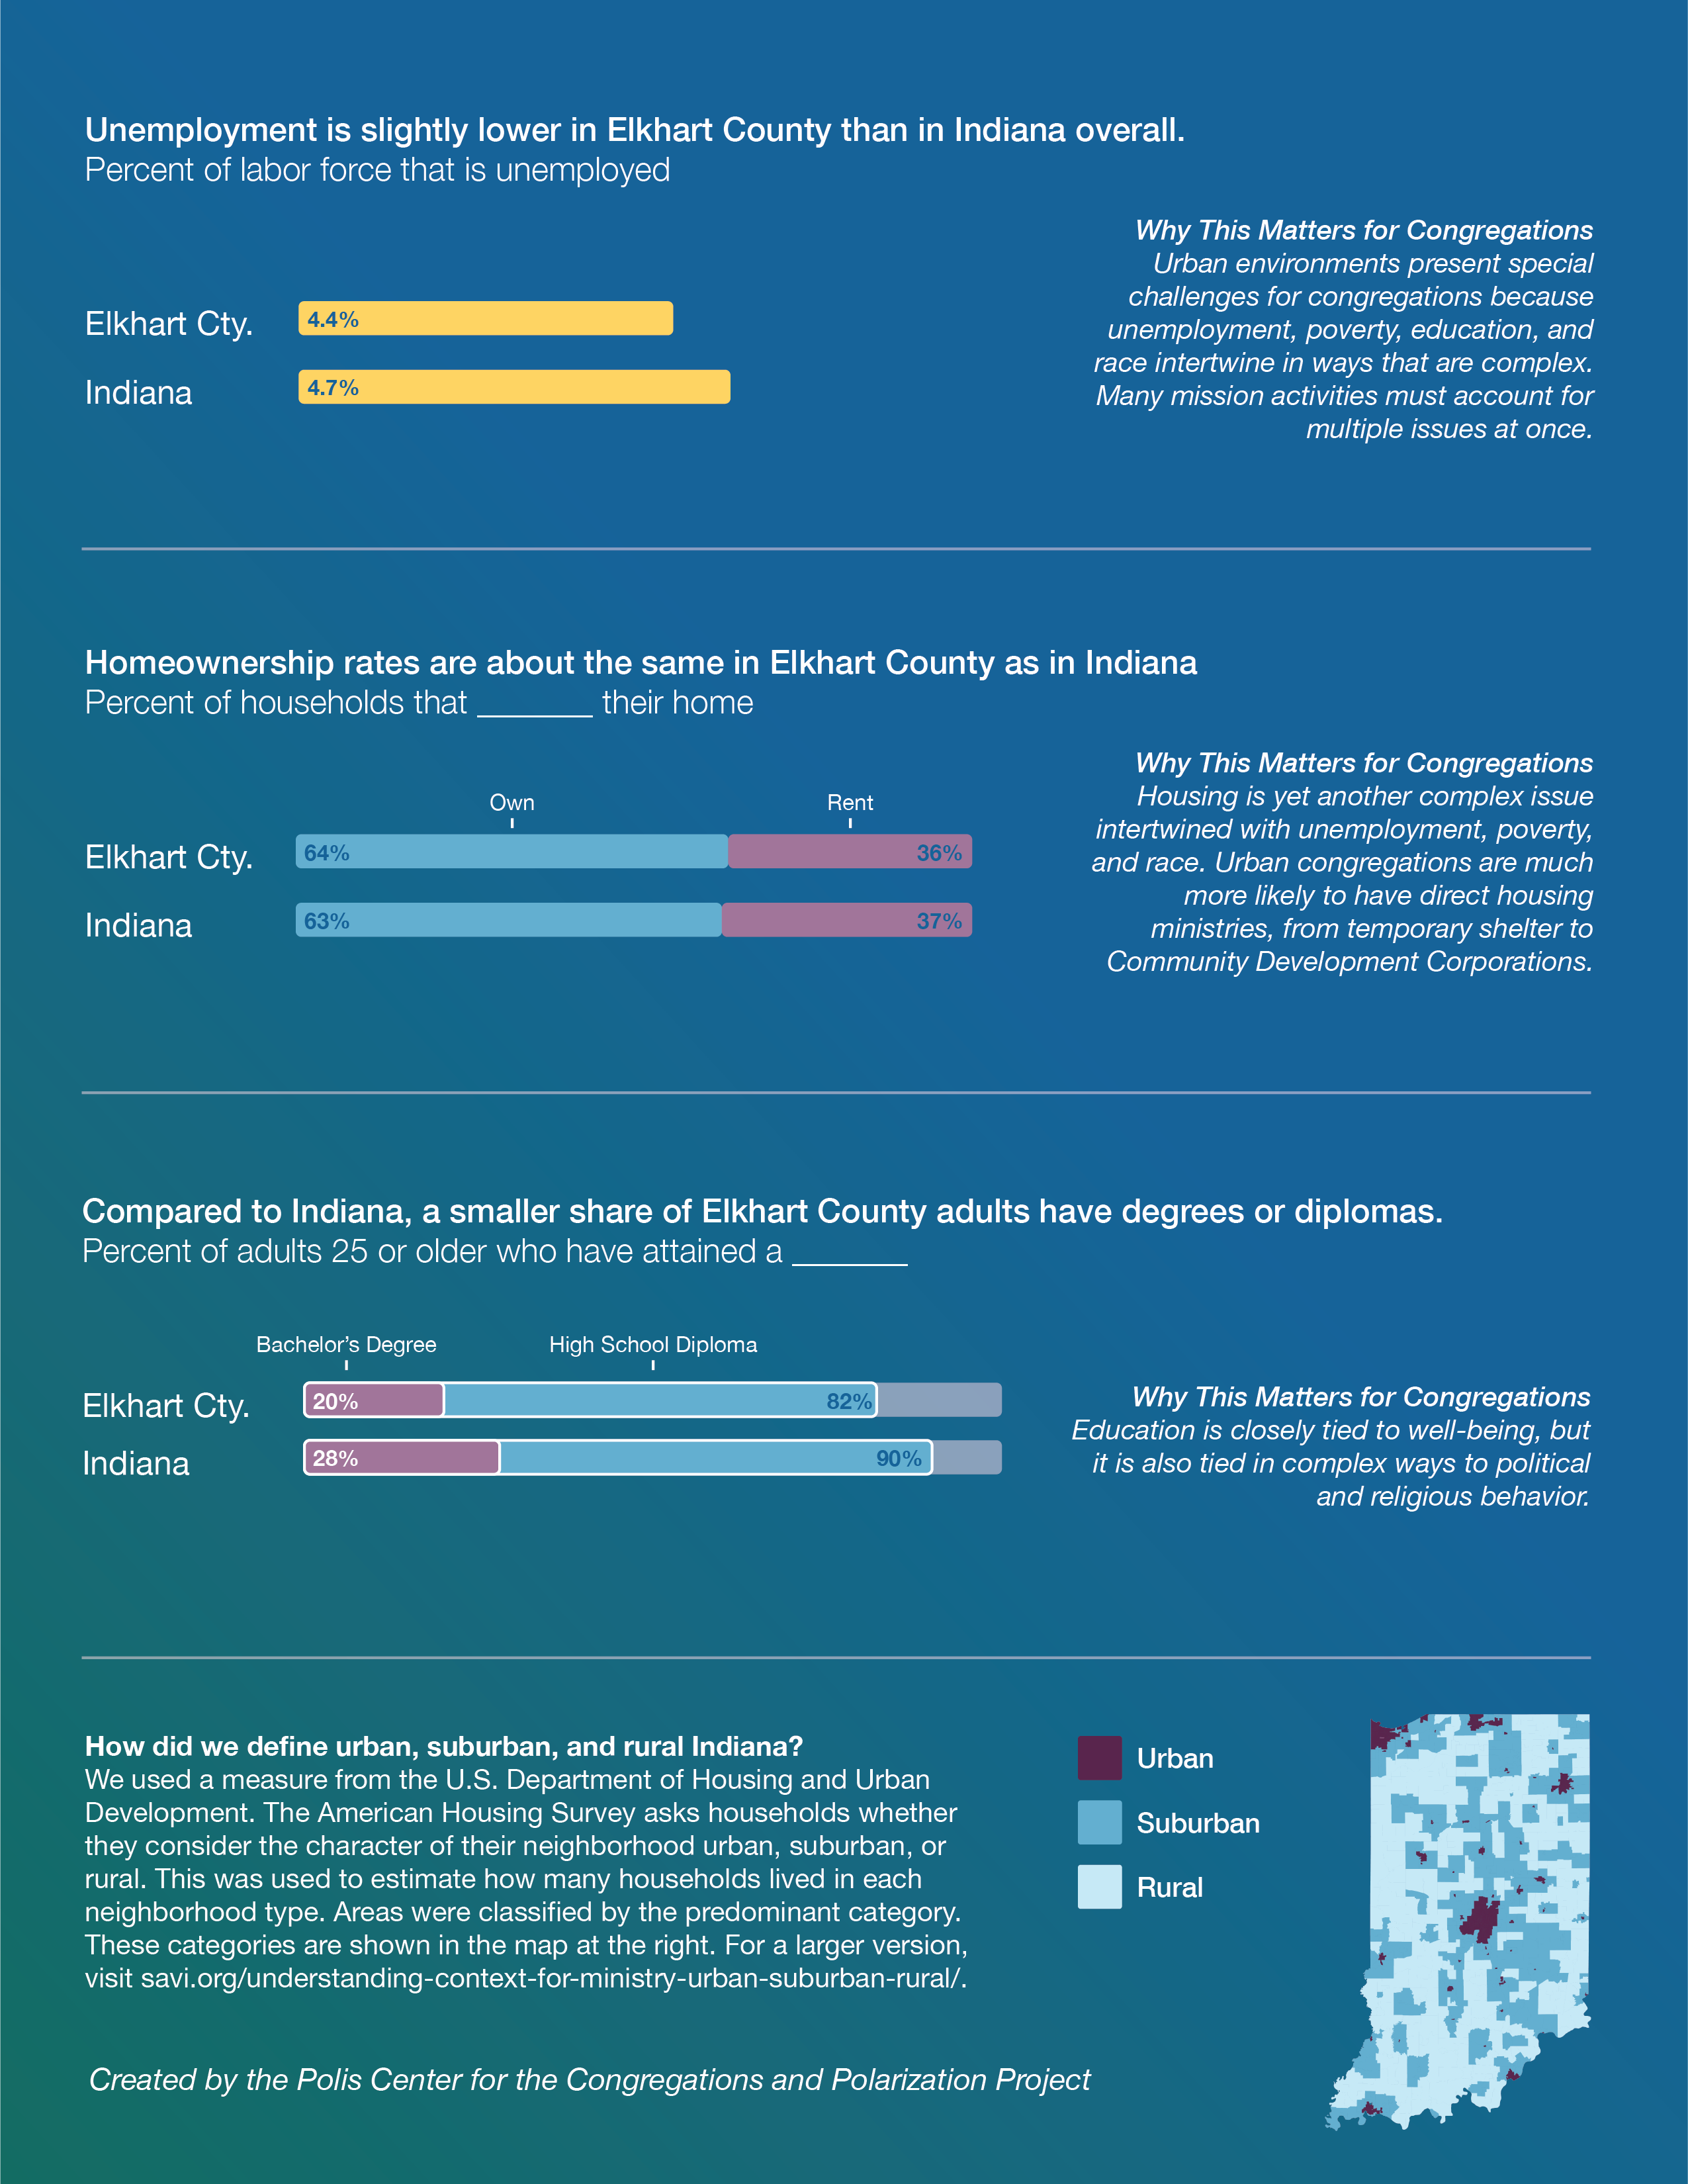
Elkhart County
Suburban Indianapolis
Crawford County
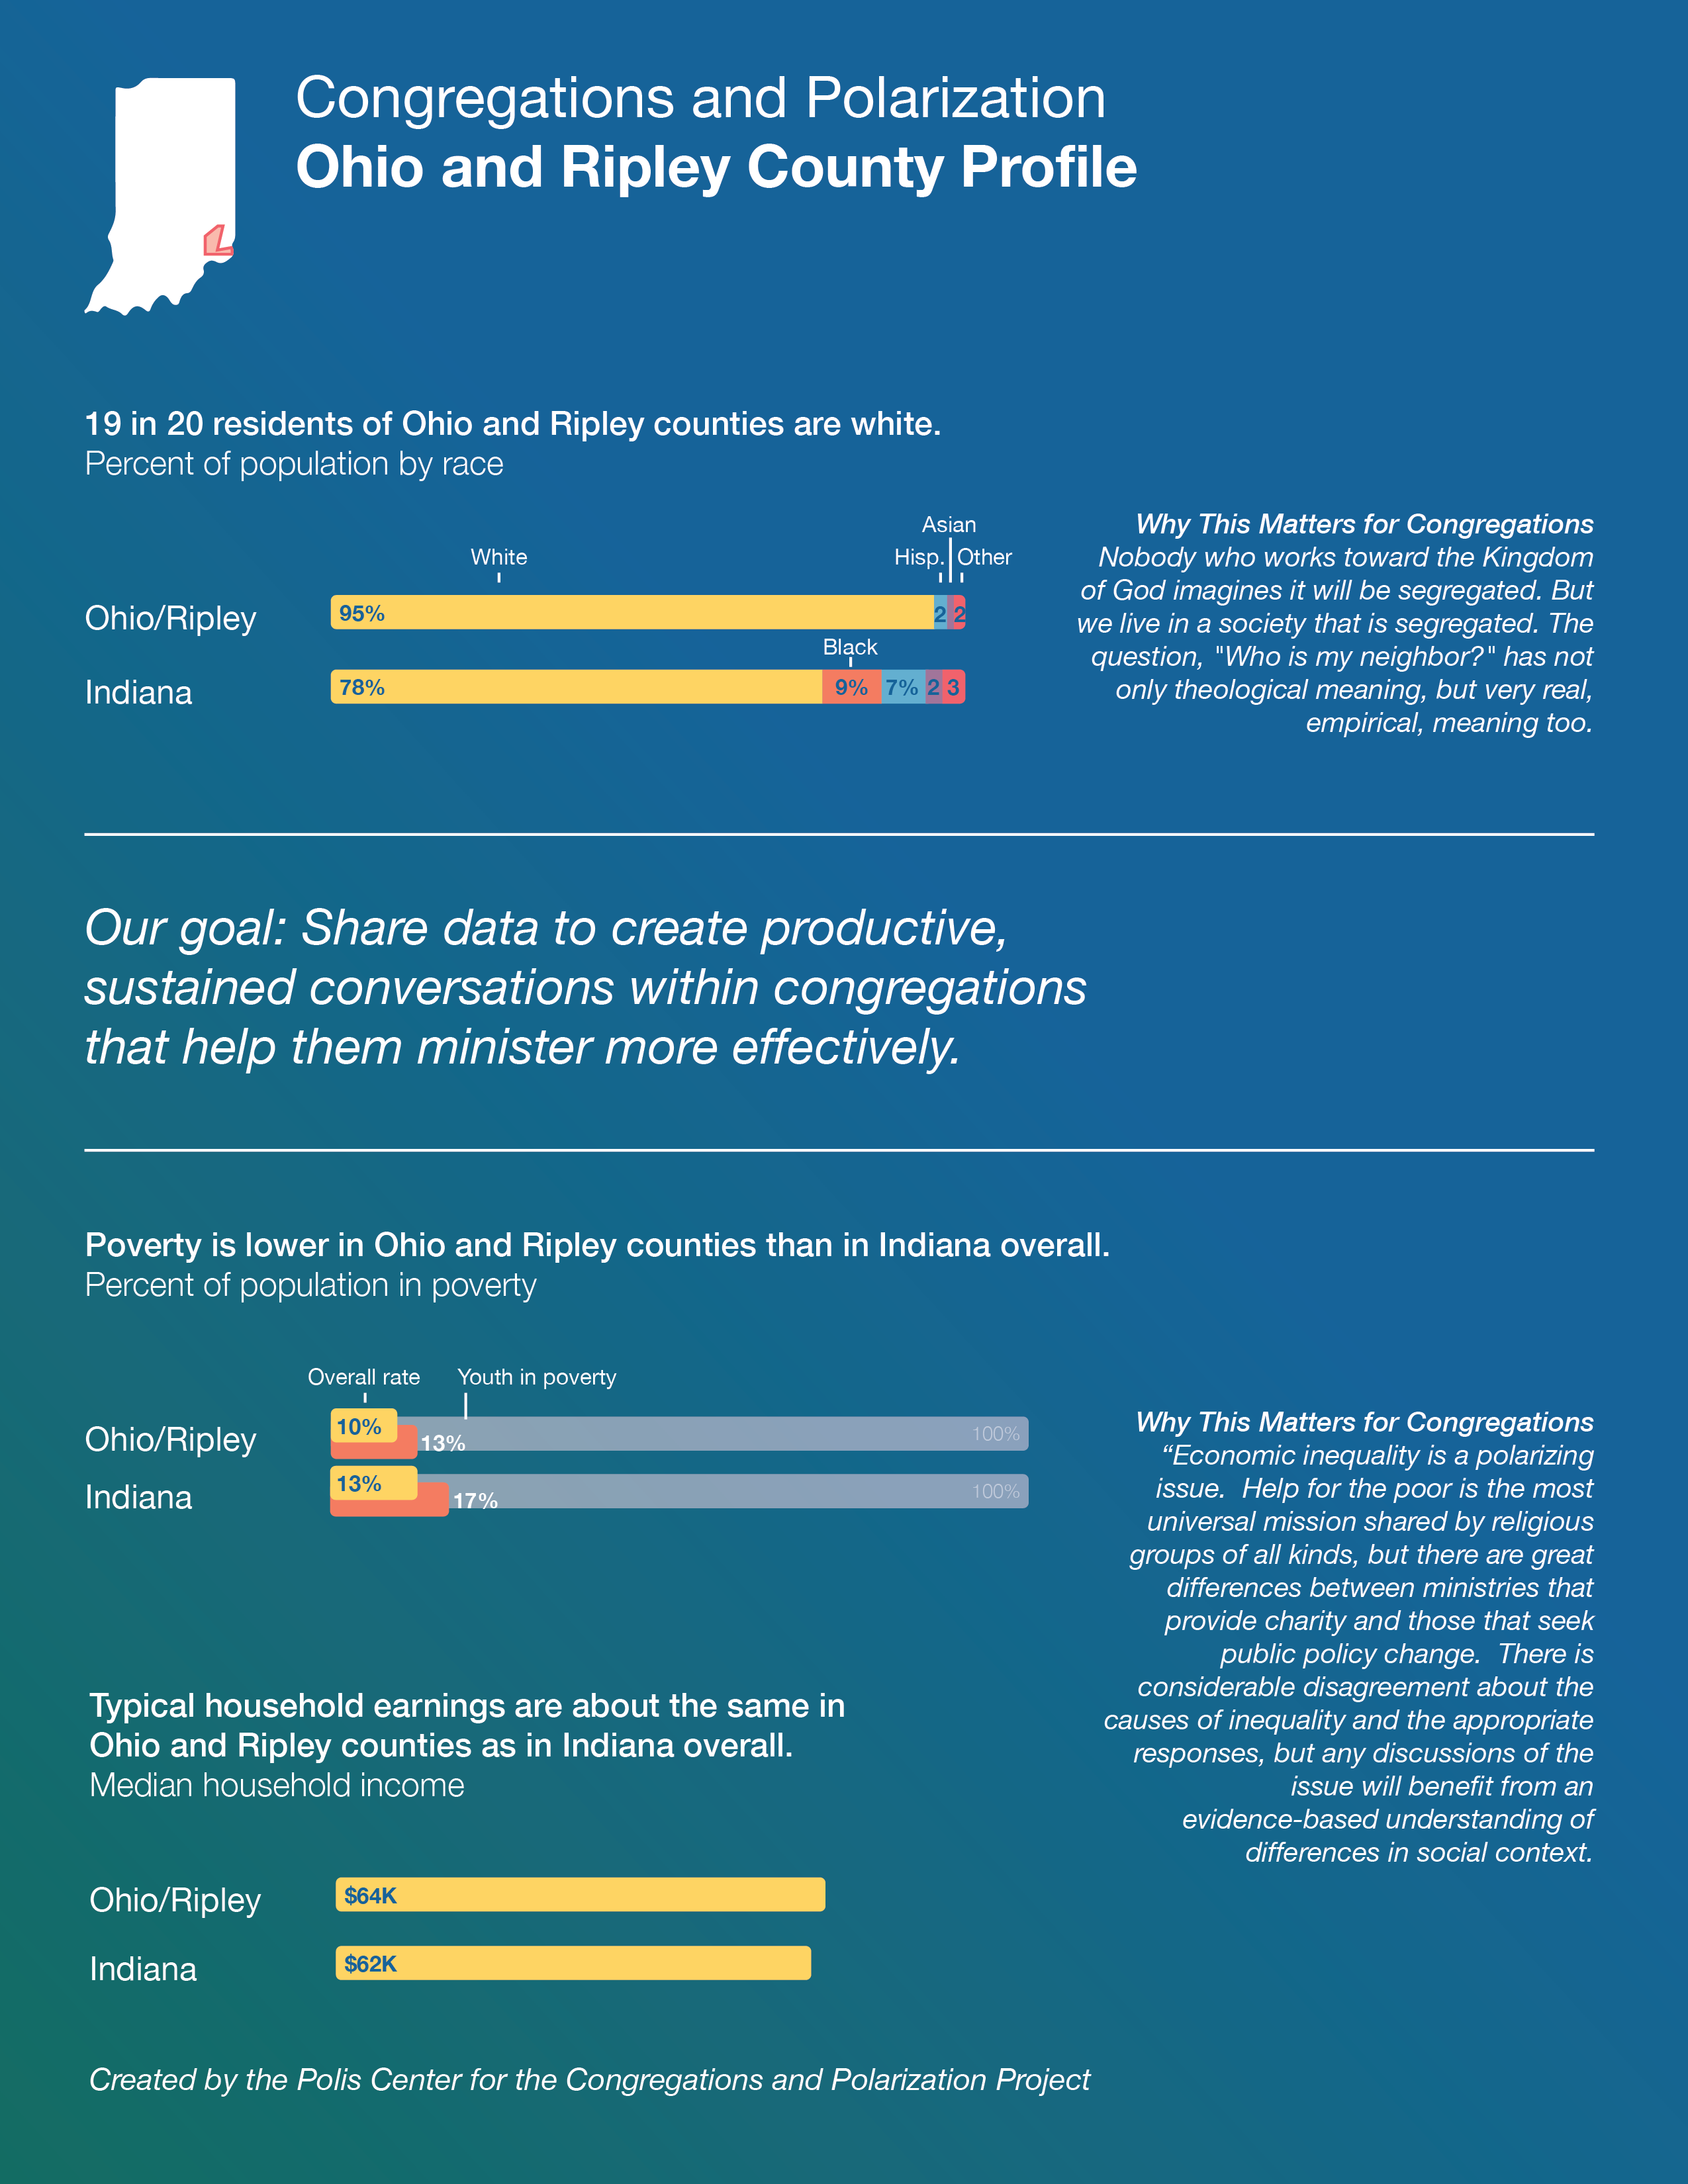
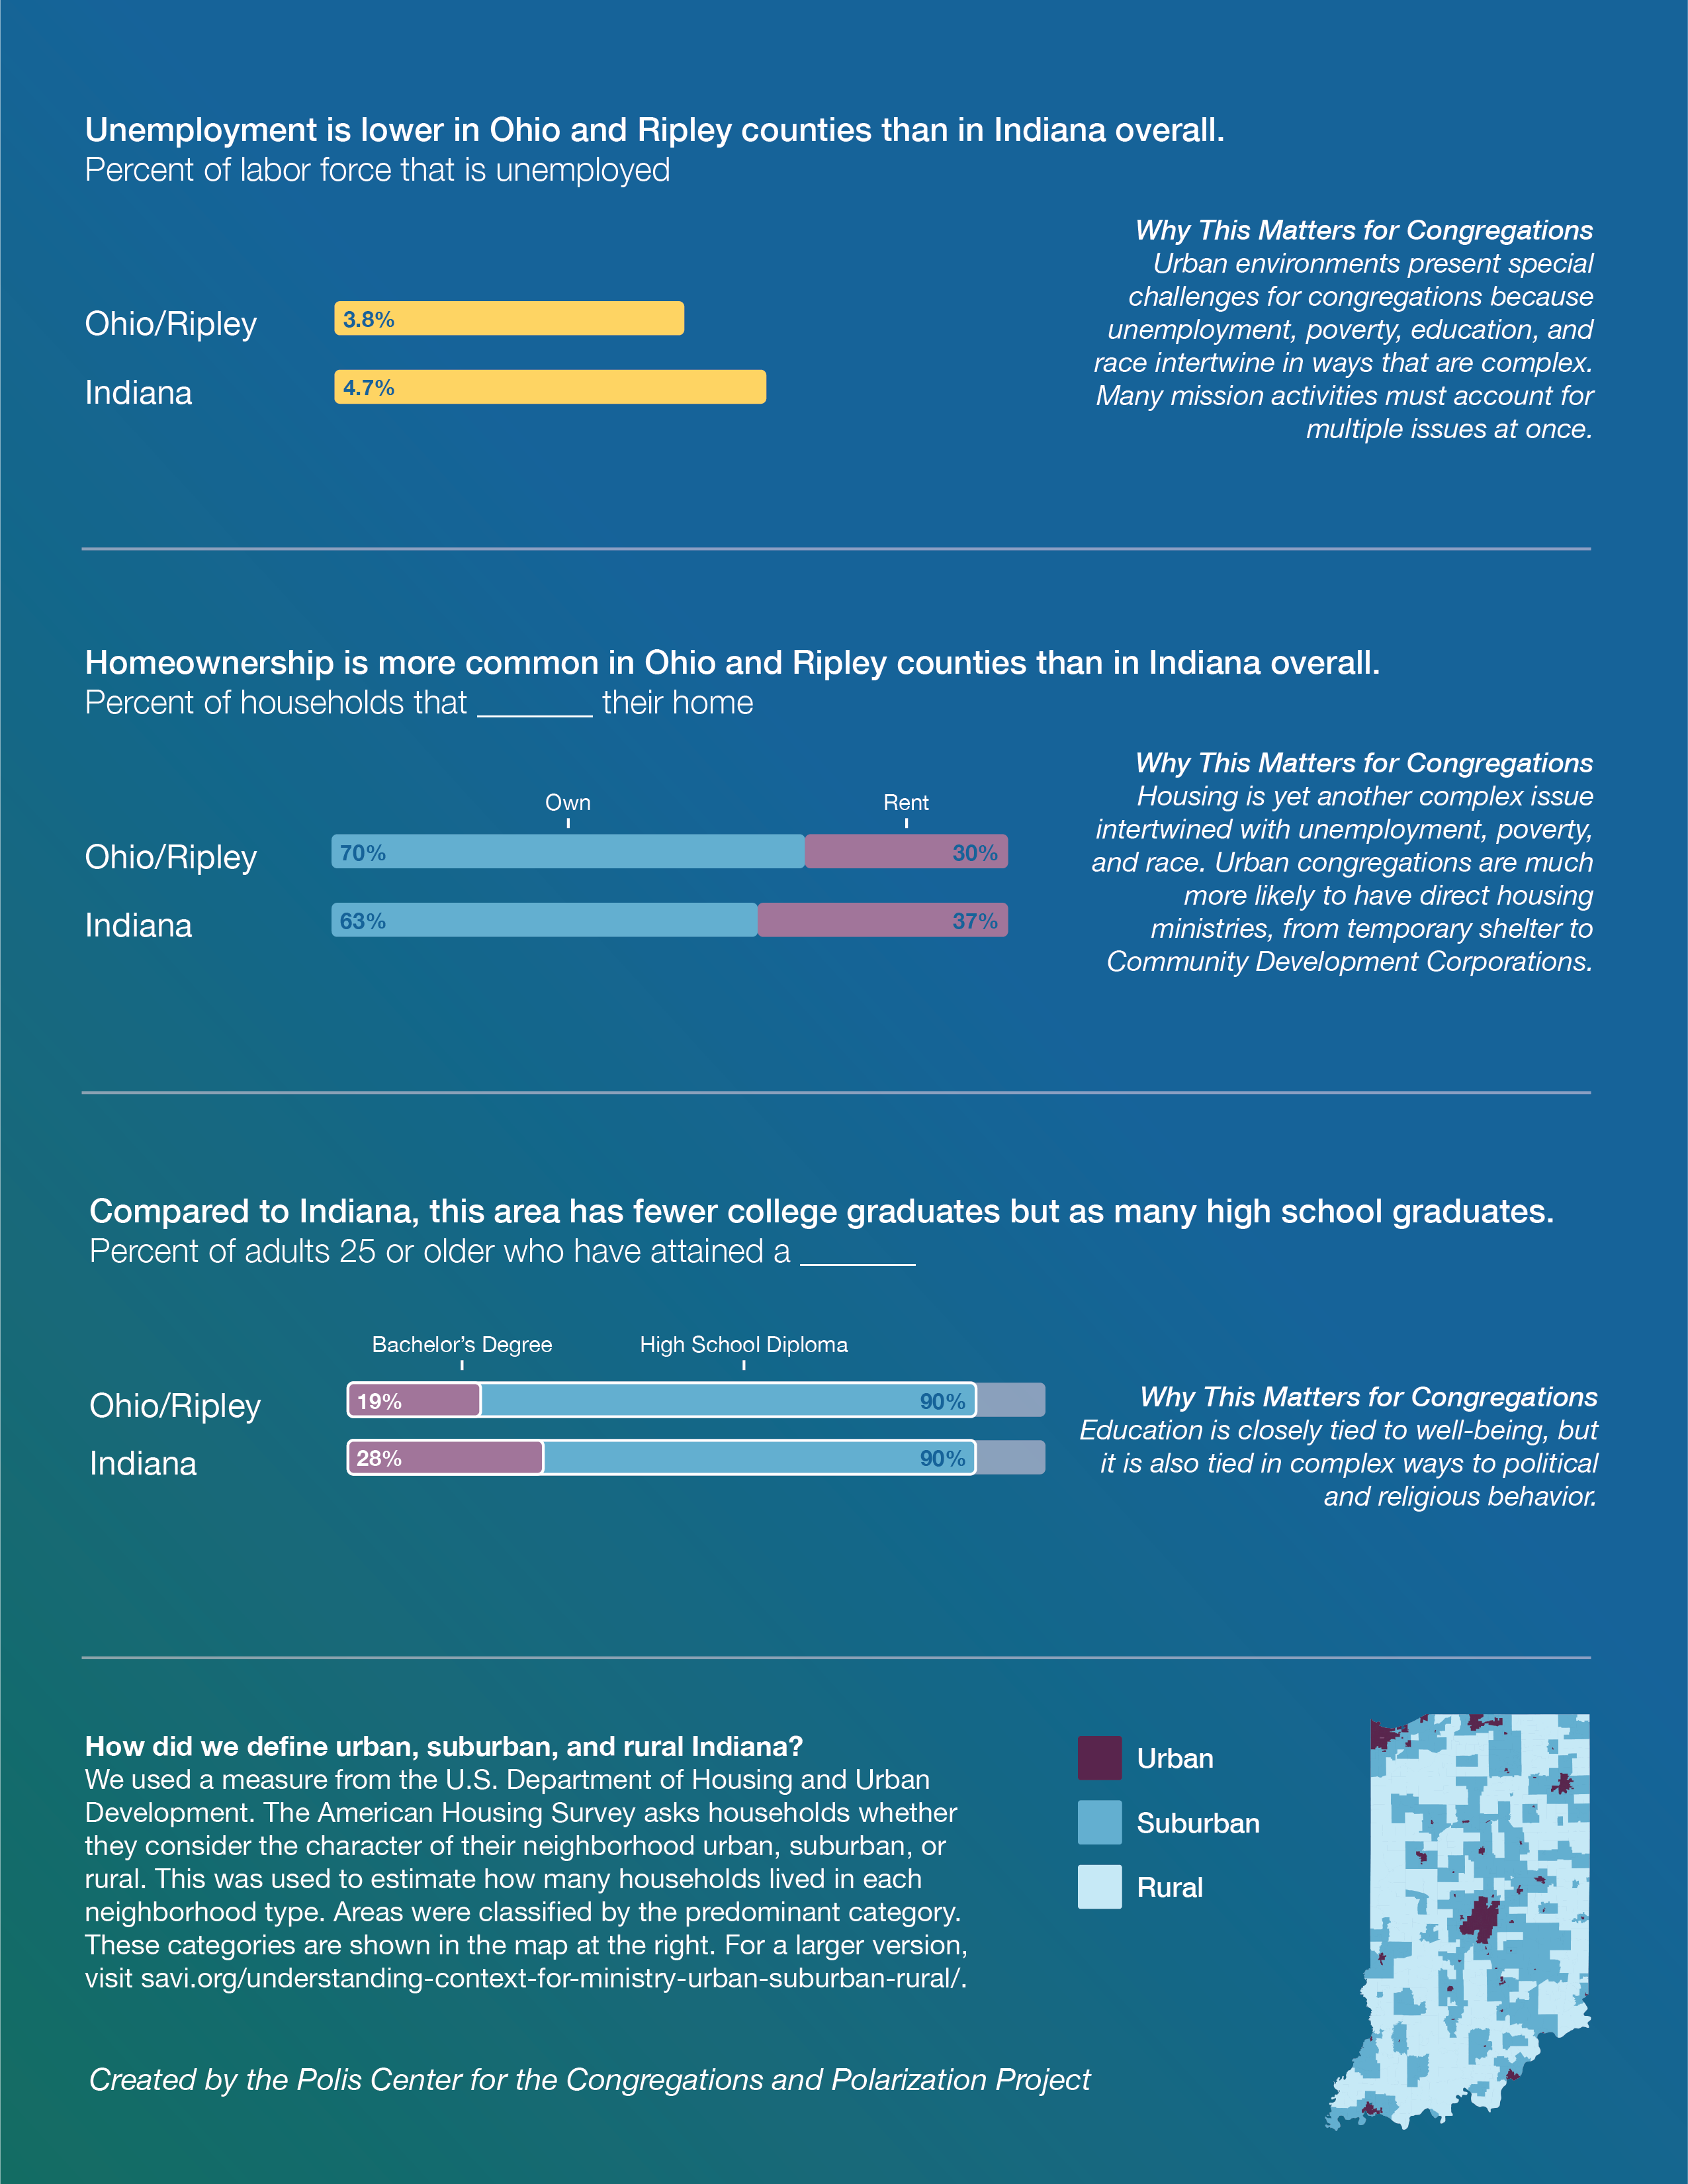
Ohio & Ripley County
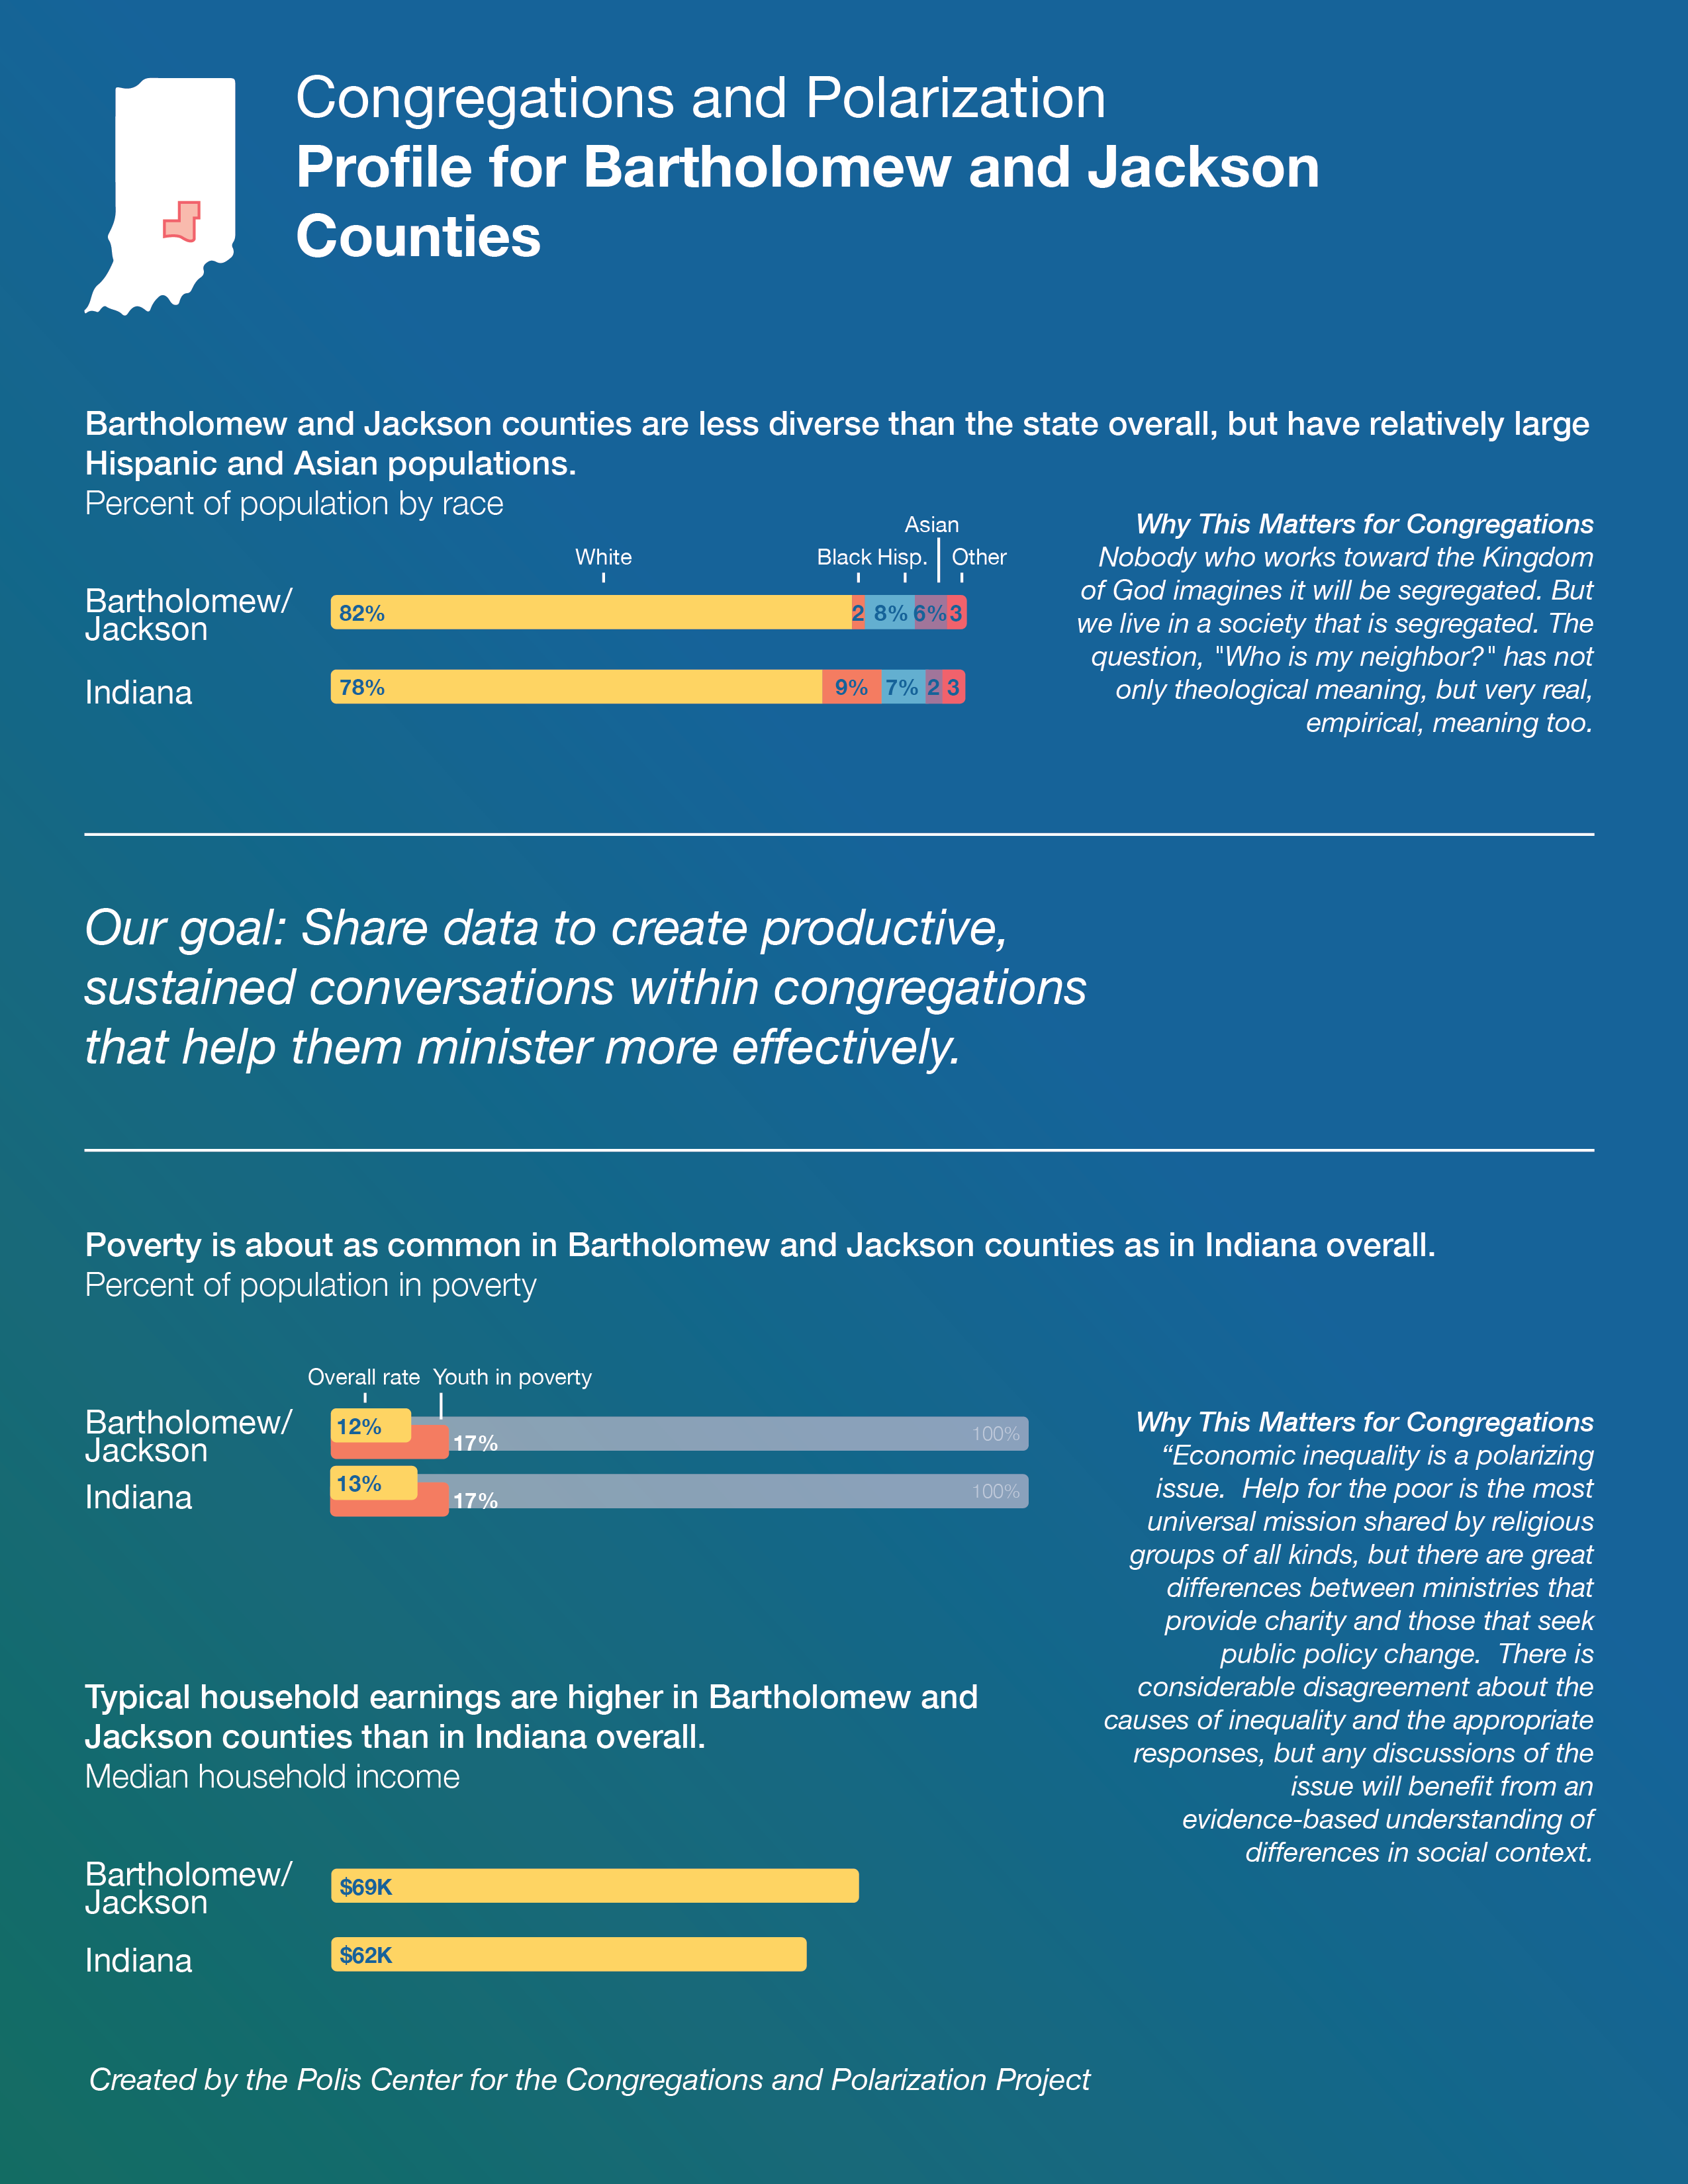
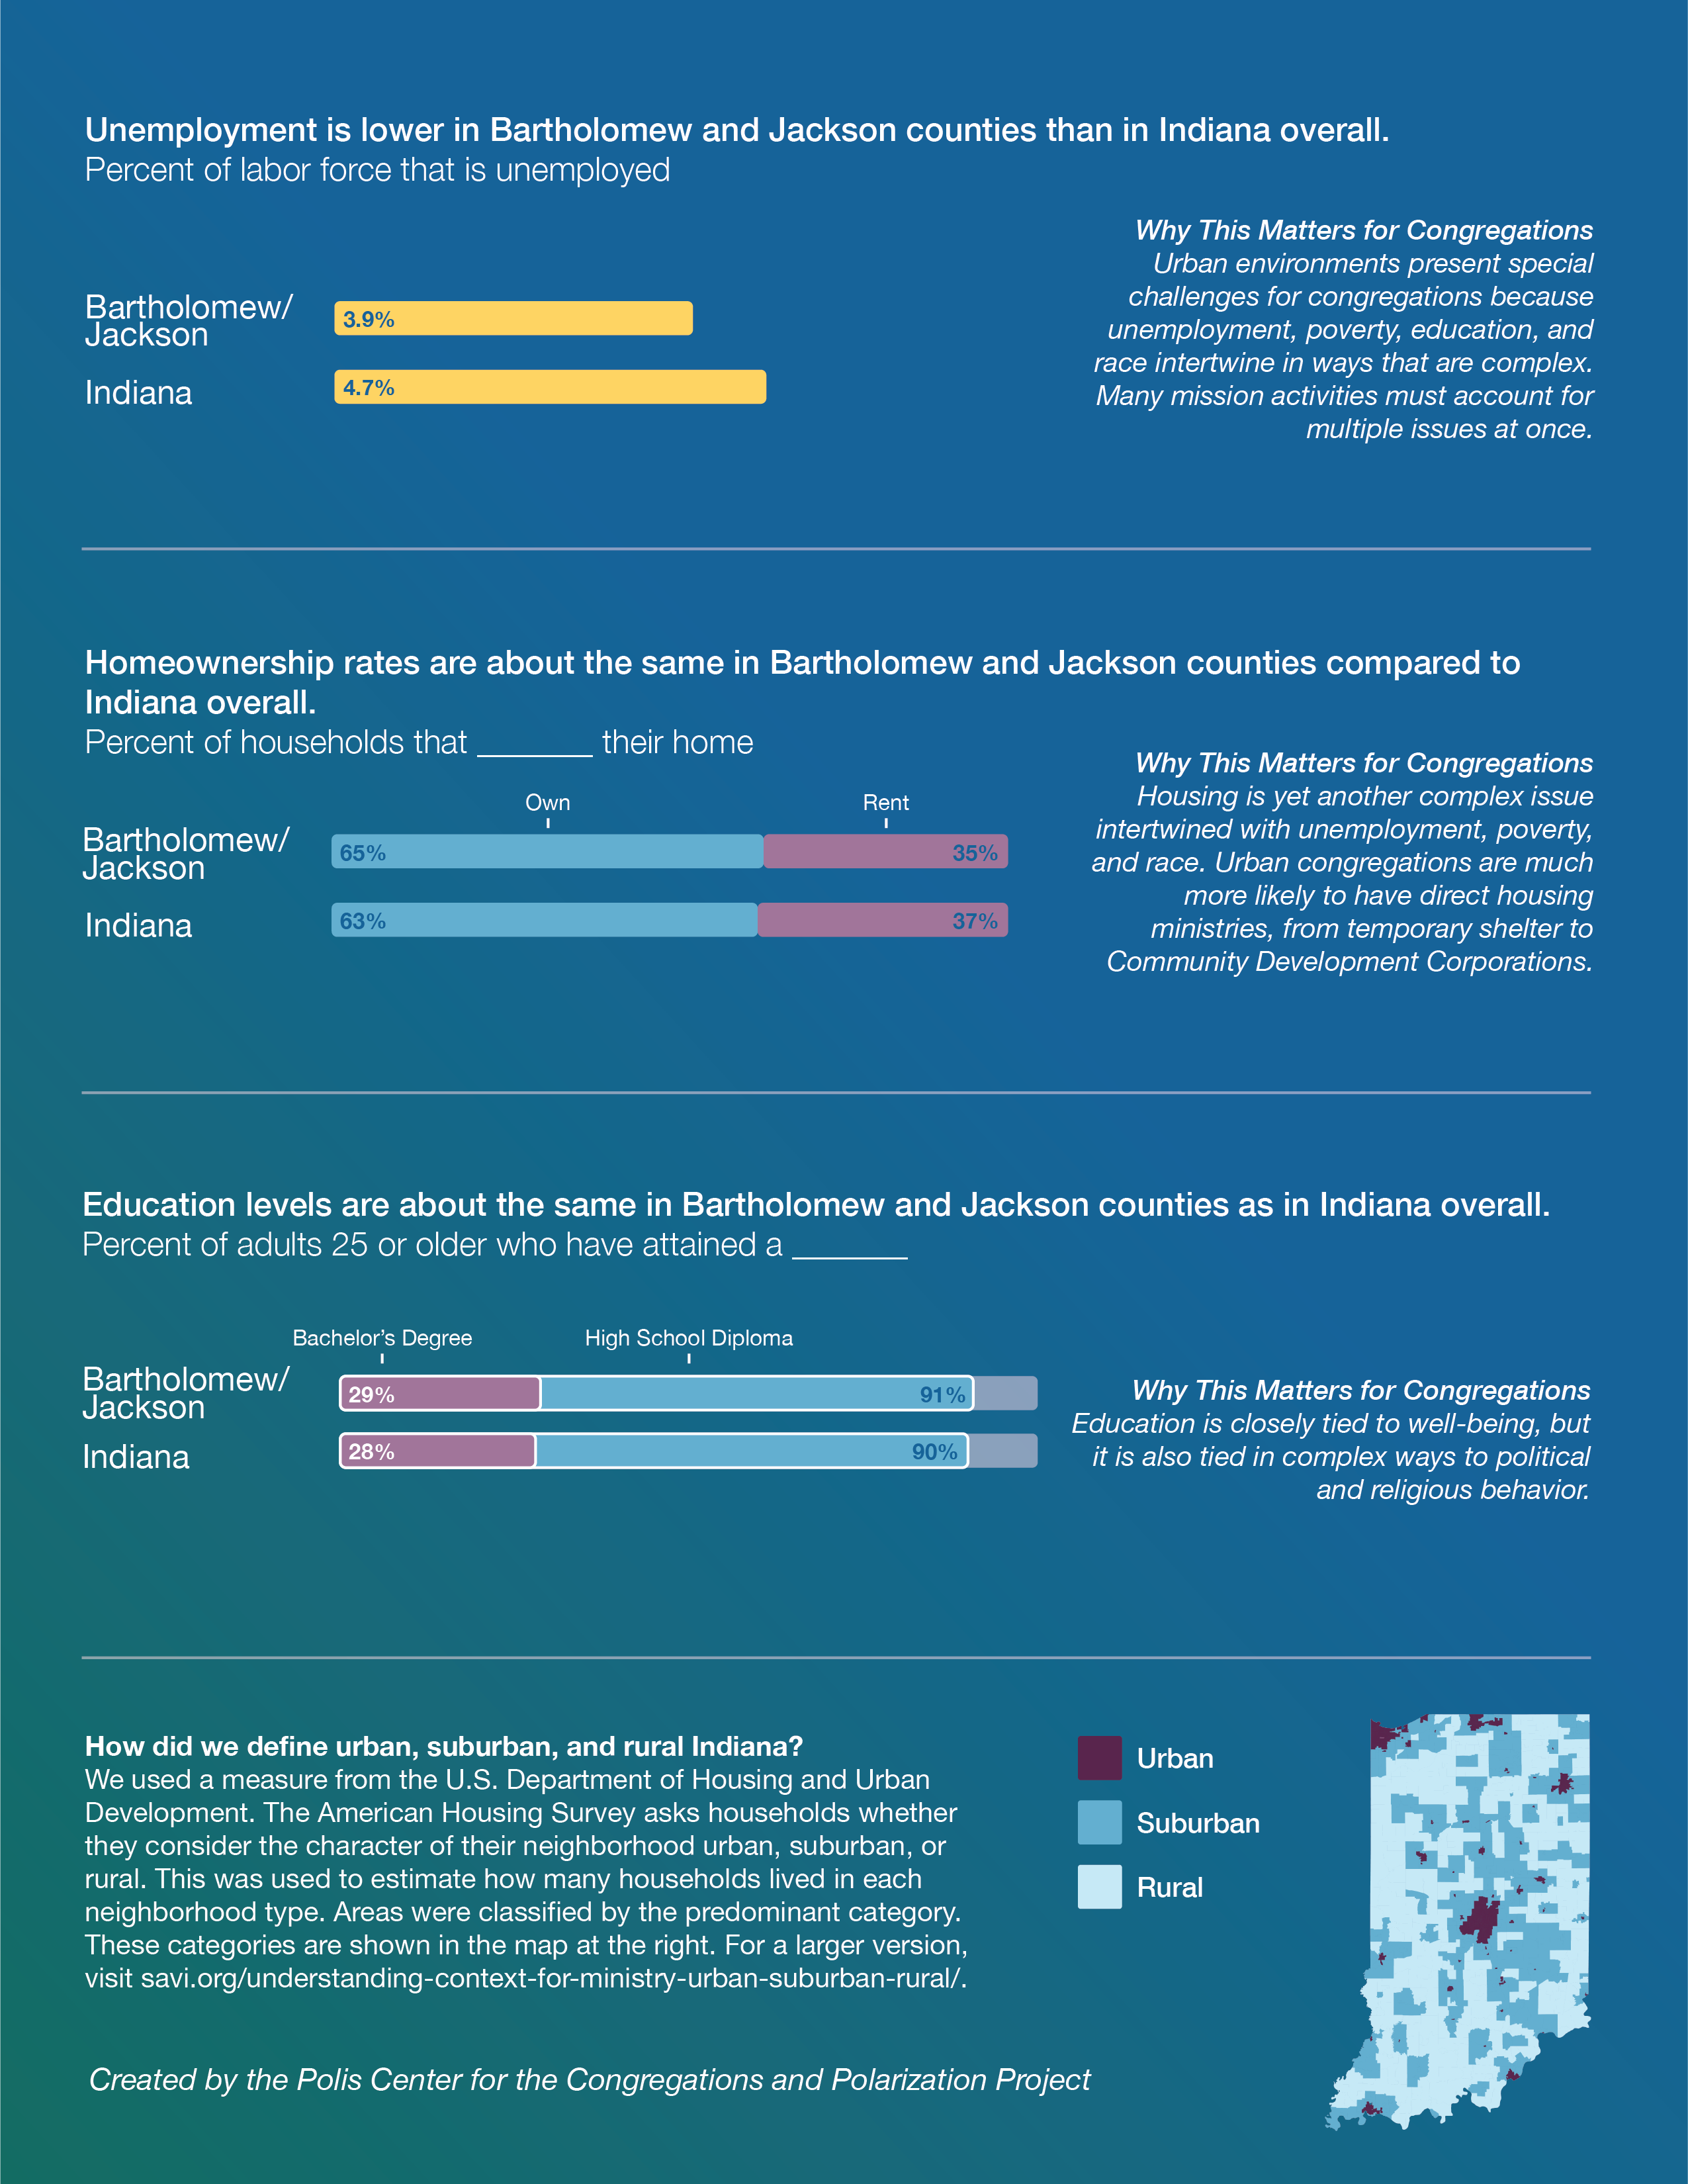
Bartholomew & Jackson Counties
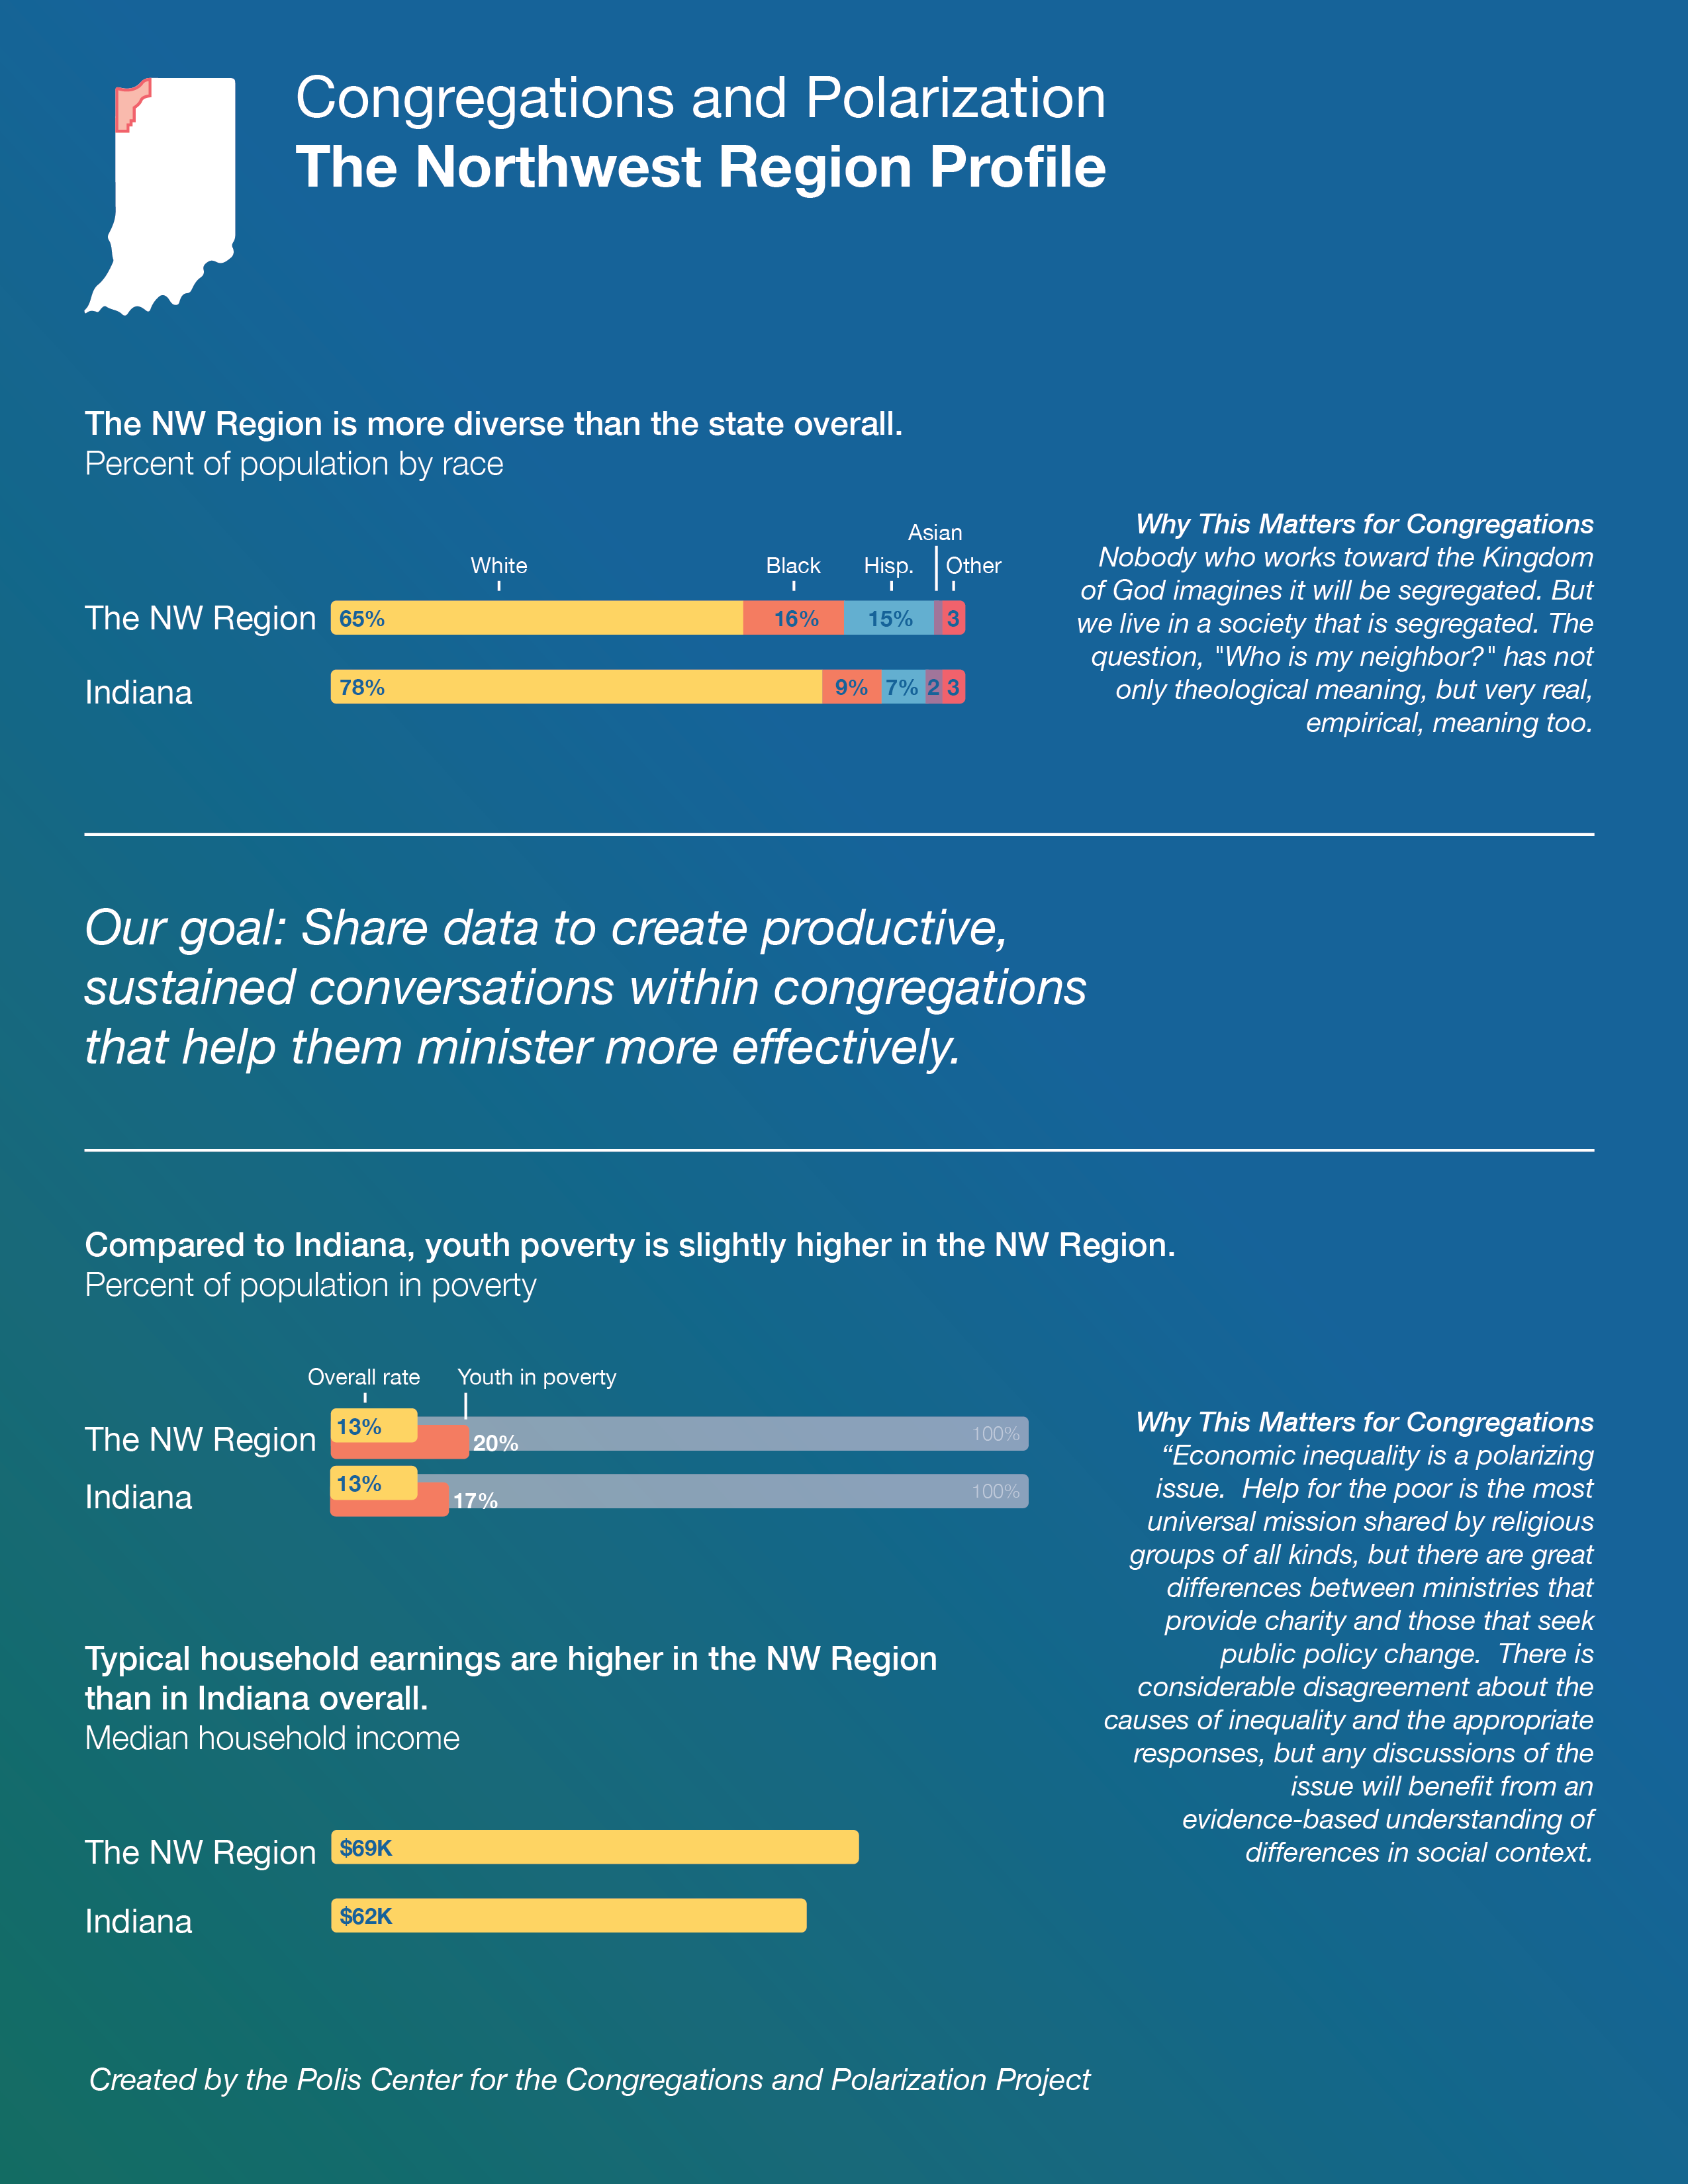
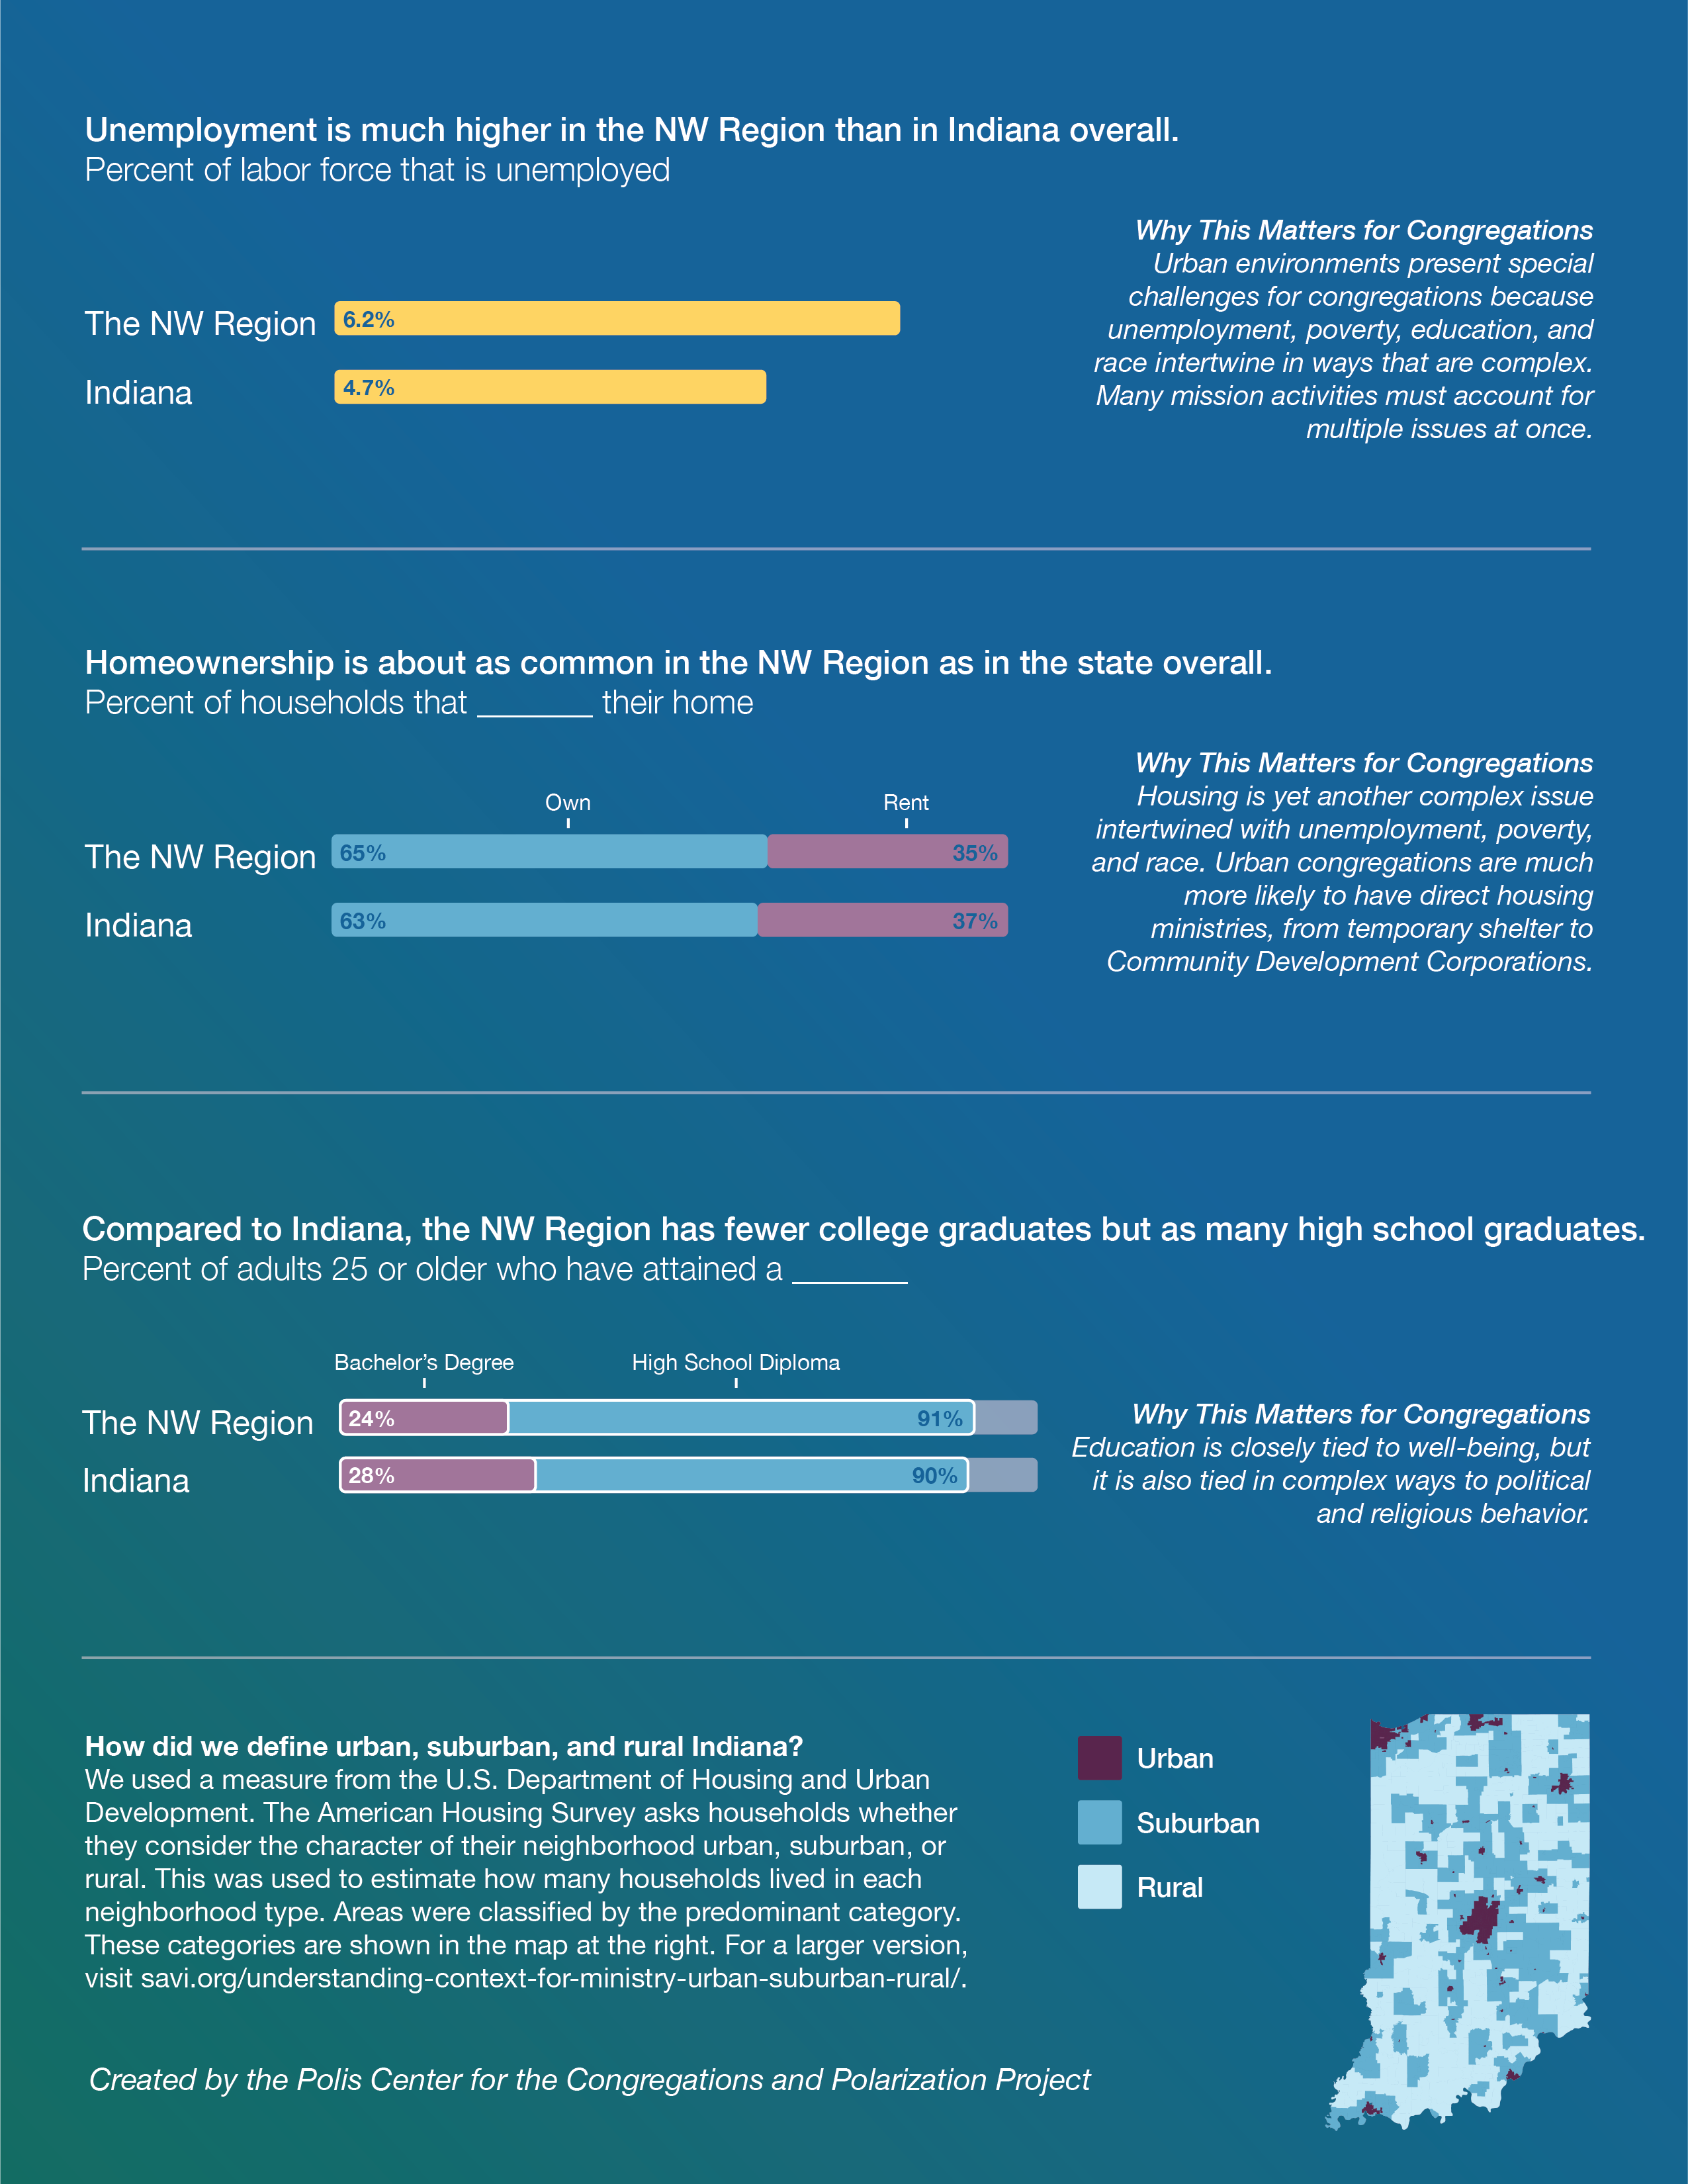
Northwest Region
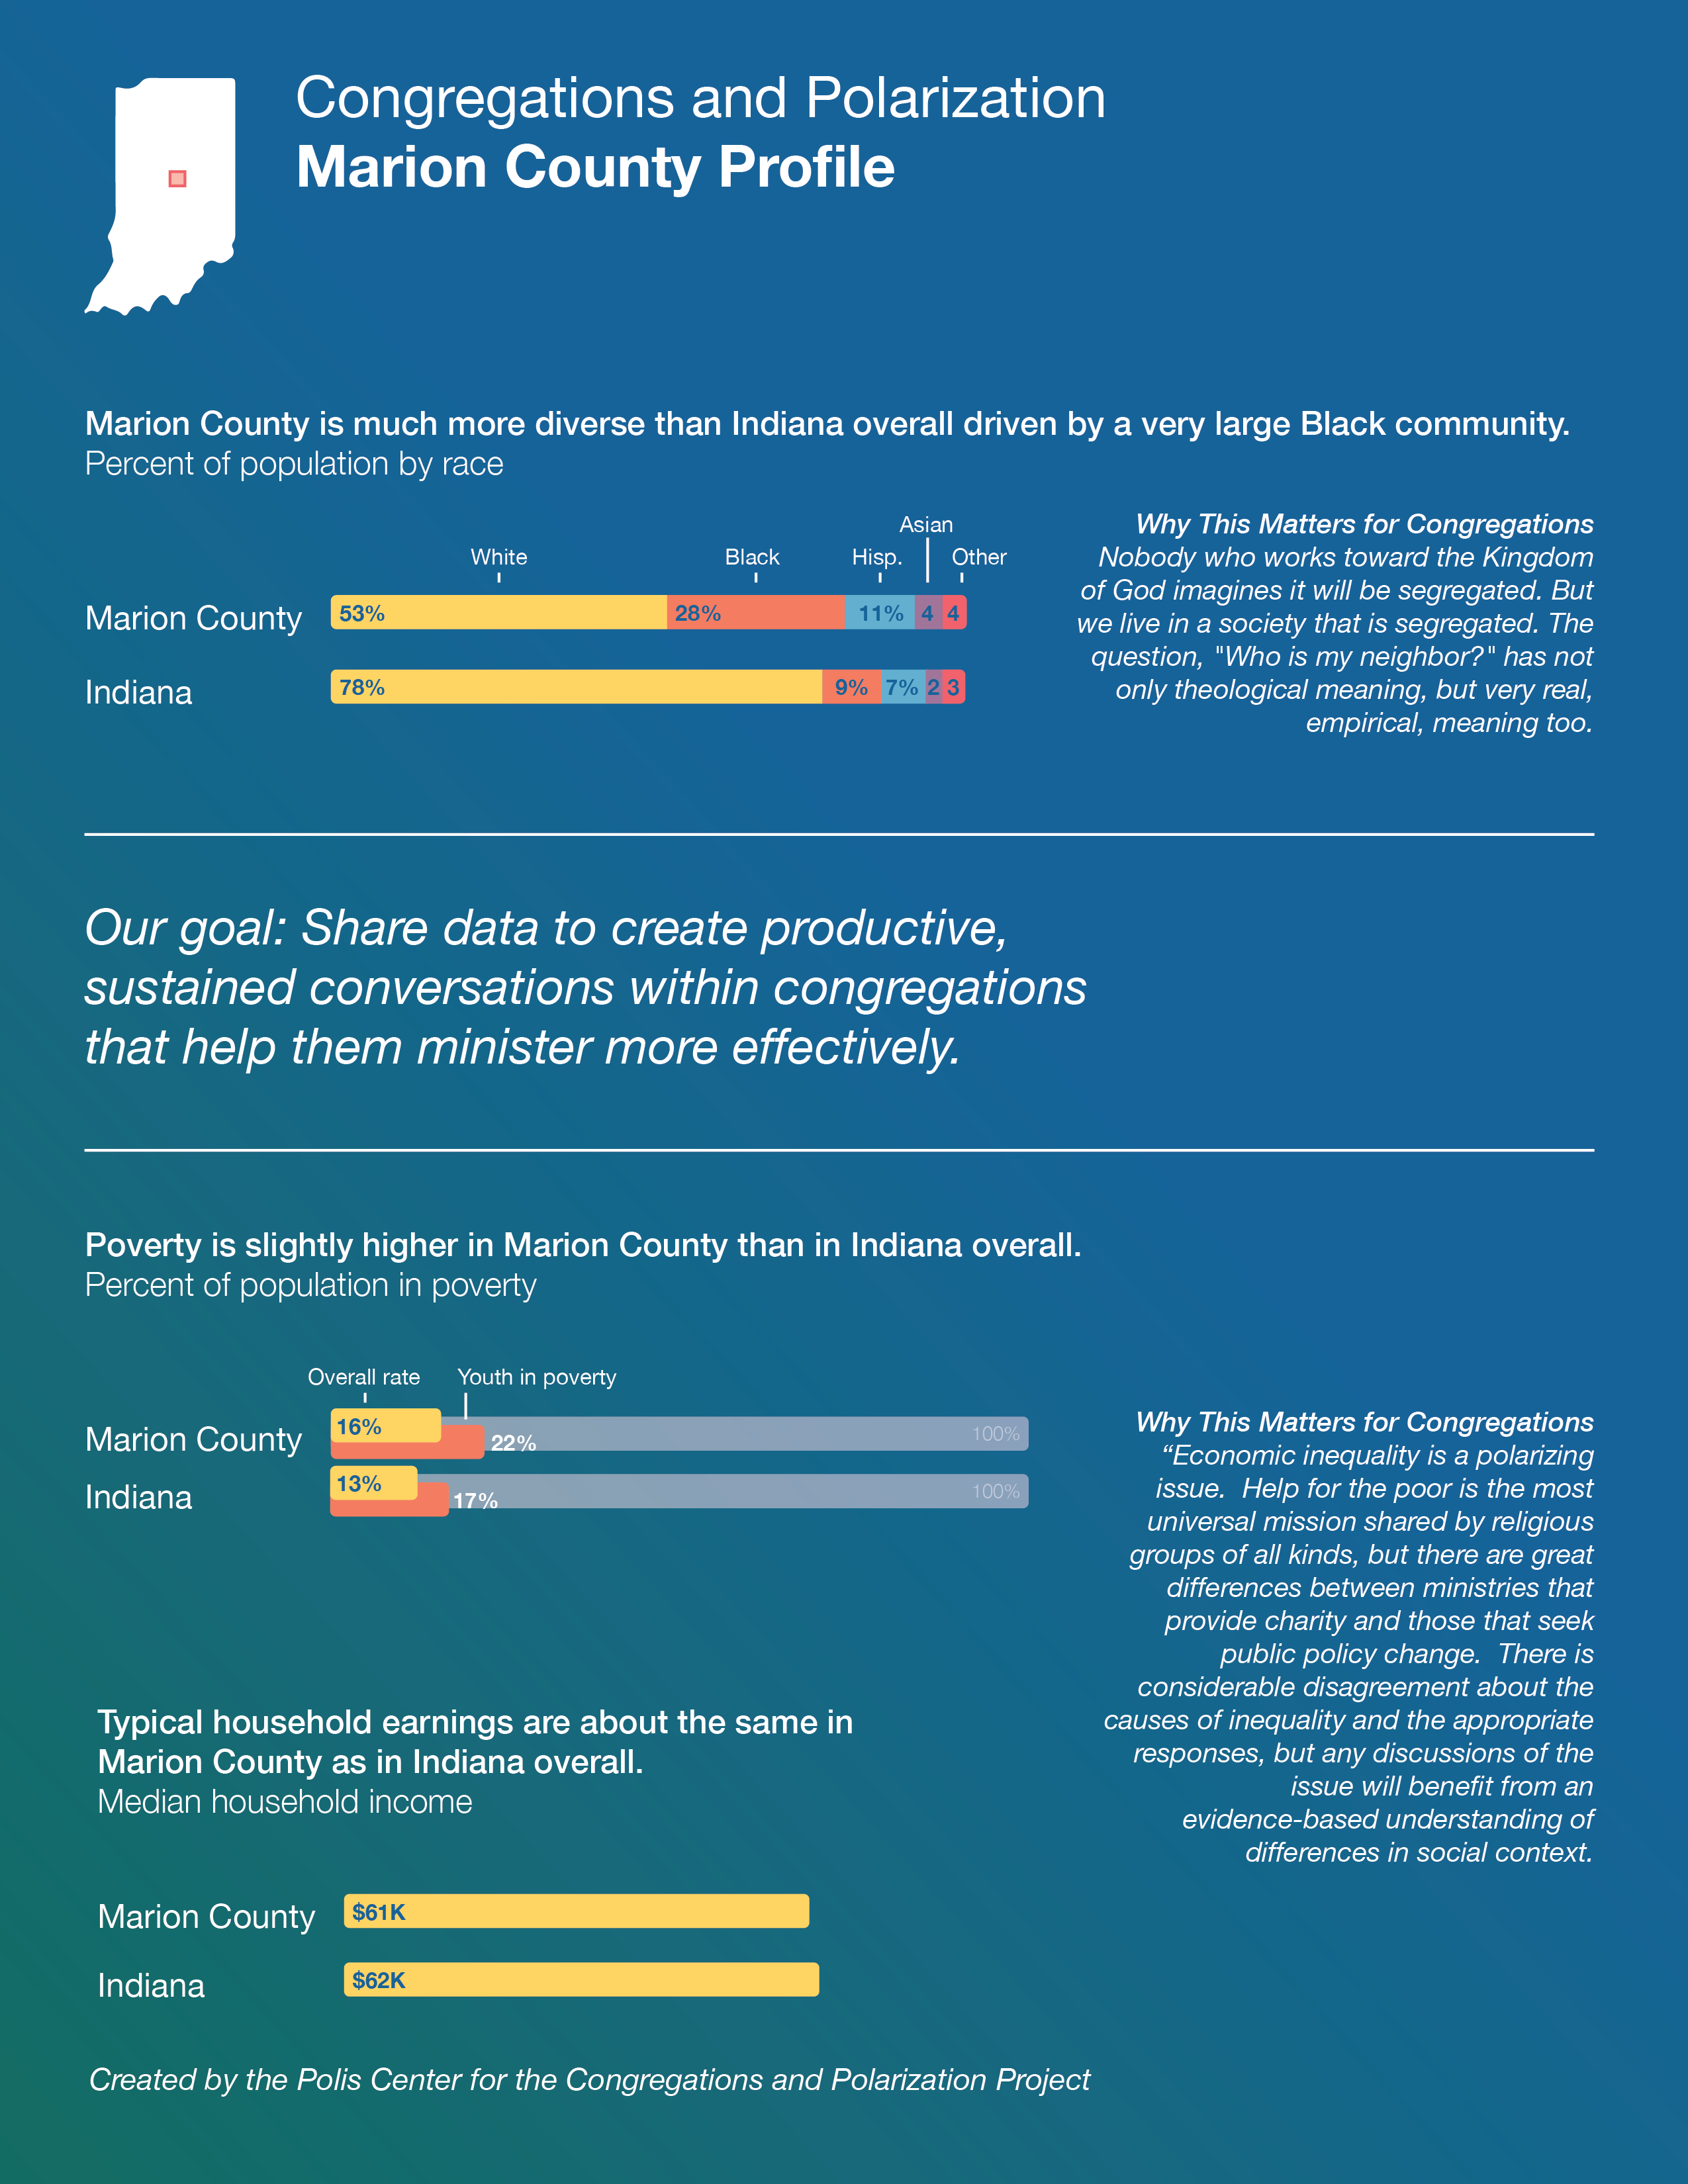
Marion County

Appendix
All Demographics: Urban, Suburban Rural

All Demographics: All Study Areas