Equity and Criminal Justice
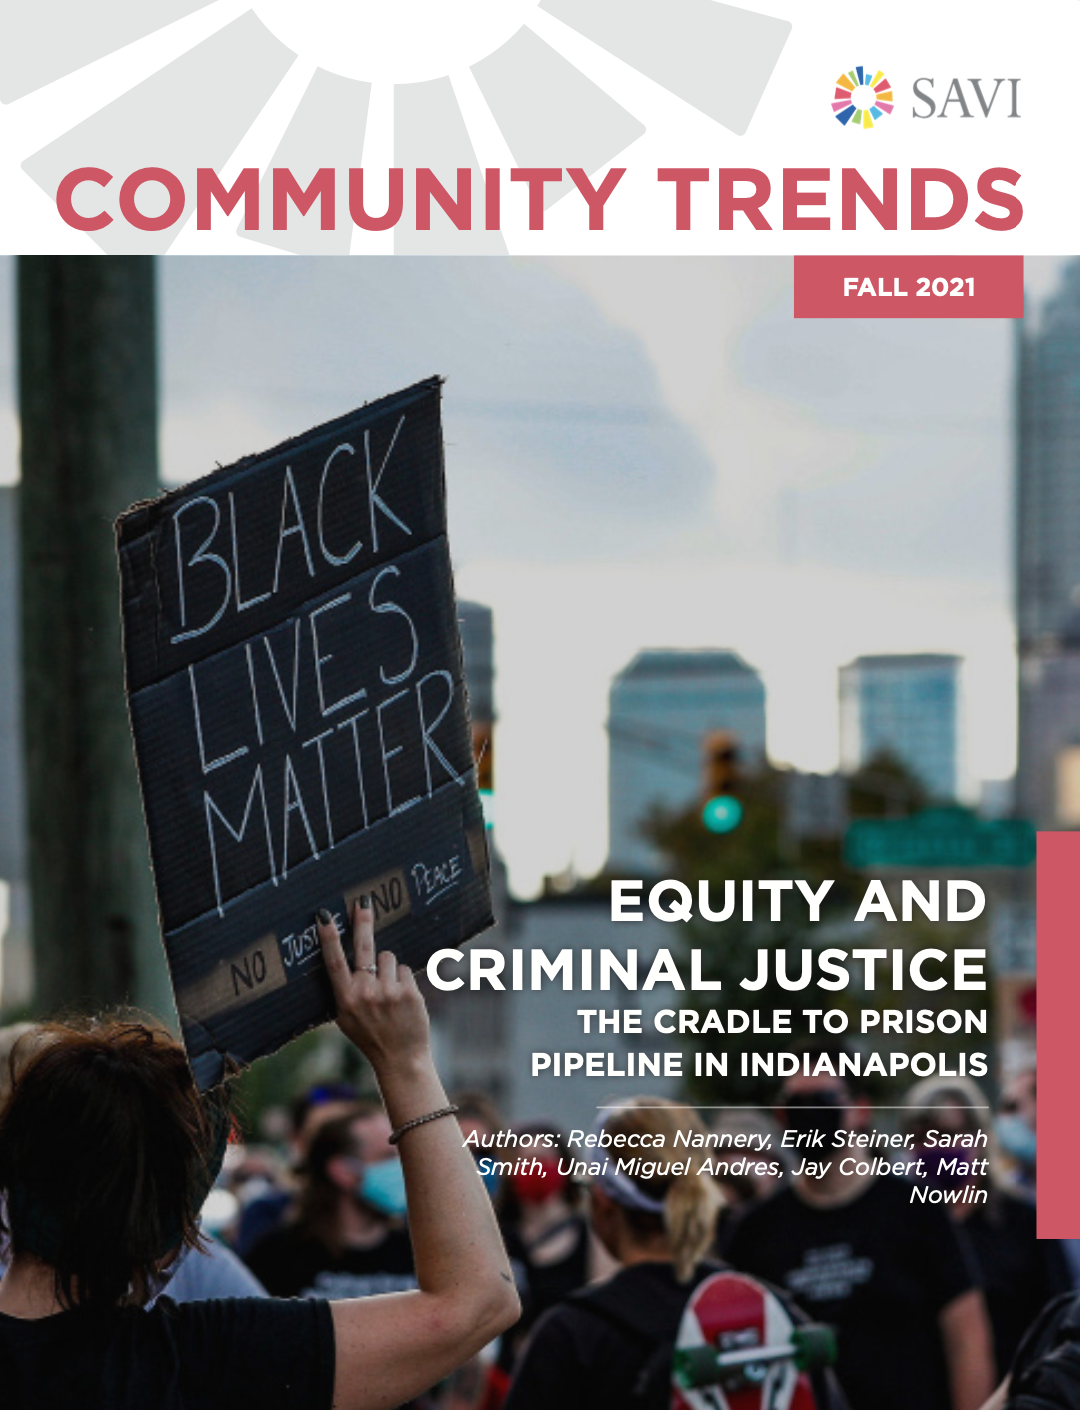
SAVI Talks - November 18, 2021An individual’s interaction with the criminal justice system is not necessarily a random event: Research shows that beginning from birth, various factors including disability, race, gender, and economic status result in disproportionate impact on subpopulations in a way that makes them more likely to engage with the criminal justice system. These factors, and policies that alleviate or compound existing inequities will be examined using the Cradle to Prison Pipeline framework.
This report examines a concept called the “cradle to prison pipeline.” It is a review of some of the basic statistics at each stage of this pipeline: childhood, school, juvenile justice, early adulthood, and imprisonment. For each stage, we present basic trends and disparities across race, place, gender, and other demographic variables.
Research has shown that highlighting racial disparities can actually increase support for policies that perpetuate inequality, such as “stop and frisk.” With caution, this report maintains a focus on disparities, particularly between Black and white residents, because those are indicative of problems within systems and not the inherent criminality of individuals or populations.
Black and white jail population per 100,000 people age 15-64 (five-year average)
Indiana
Marion County
Community Trends Report
SAVI Talks Presentation
Introduction & Report Presentation:
Panel Discussion & Closing Remarks:
Articles and Story Maps
Explore other research and interactive content we have developed around equity.
Greenspace Assessment for Marion County
Greenspace is an important component of urban centers and can have many beneficial effects for both humans and the environment. However, greenspace is not equal across an entire urban center, nor can it be developed in the same ways throughout a city. Based on a...
Academic Standardized Test Scores for the Hearing Aid Assistance Program of Indiana (HAAPI) Participants and Applicants
This research was funded and produced in partnership with Hear Indiana, whose mission is to create equal opportunities for children with hearing loss through Listening & Spoken Language services.Summary Hear Indiana is partnering with the Polis Center to...
Equity in Criminal Prosecutions: Analyzing Case Filings from the Marion County Prosecutor’s Office
The Kheprw Institute and The Polis Center are partnering to better understand the criminal justice system in Marion County and investigate potential disparities. Previous research from the Polis Center estimated that Black residents of Marion County were 2.7 times...
Support and Training
OUR EMPHASIS: Analysis We turn data into actionable information and share those results in accessible formats.Interactive Data Tools We build web platforms where the public can freely access data and knowledge.Data Integration We integrate data from a multitude of...
2022 Midterm Election Voter Turnout in Marion County
Key points Voter turnout in Marion County is low relative to Indiana and the U.S. Within Marion County, there is great variation in voter turnout between precincts Lower voter turnout in Marion County tends to occur in areas that are less affluent, have lower...
Transportation Equity and the Older Adult Population
Access to transportation is important because it empowers older adults to maintain their independence. Transportation opportunities for older adults may take different forms, including driving, public transportation, ride-share service, or shuttle buses. This report...
Domestic Violence in Marion County Criminal Justice System – 2022
This is an update to our 2018 report. By combining data from different elements of the criminal justice system, we reveal basic statistics about domestic violence in Marion County. Some key findings include: In 2020, there were an estimated 10,105 victims of domestic...
The Good Jobs Gap
There are one million jobs in Central Indiana, but only 43 percent are “good jobs” that pay at least $40,000 per year and provide health insurance. Understand who has good jobs and what is being done to create more.
Data & Drafts Follow the Money: Indianapolis Evictions in 2022
Eviction filings are on the rise compared to last year, but still lower than before the pandemic. Most evictions are from large owners of big apartment complexes.
Data & Drafts: A Decade of Decline: College-Going Rates in Central Indiana
An analysis of Central Indiana high schools shows that declines in college-going rates impact everyone, from affluent suburban communities to economically disadvantaged neighborhoods.
Authors
Sharon Kandris
Associate Director,
The Polis Center
Jay Colbert,
Data Manager,
The Polis Center
Jeramy Townsley,
Visiting Research Analyst,
The Polis Center
Matt Nowlin,
Research Analyst,
The Polis Center
Event Partners


