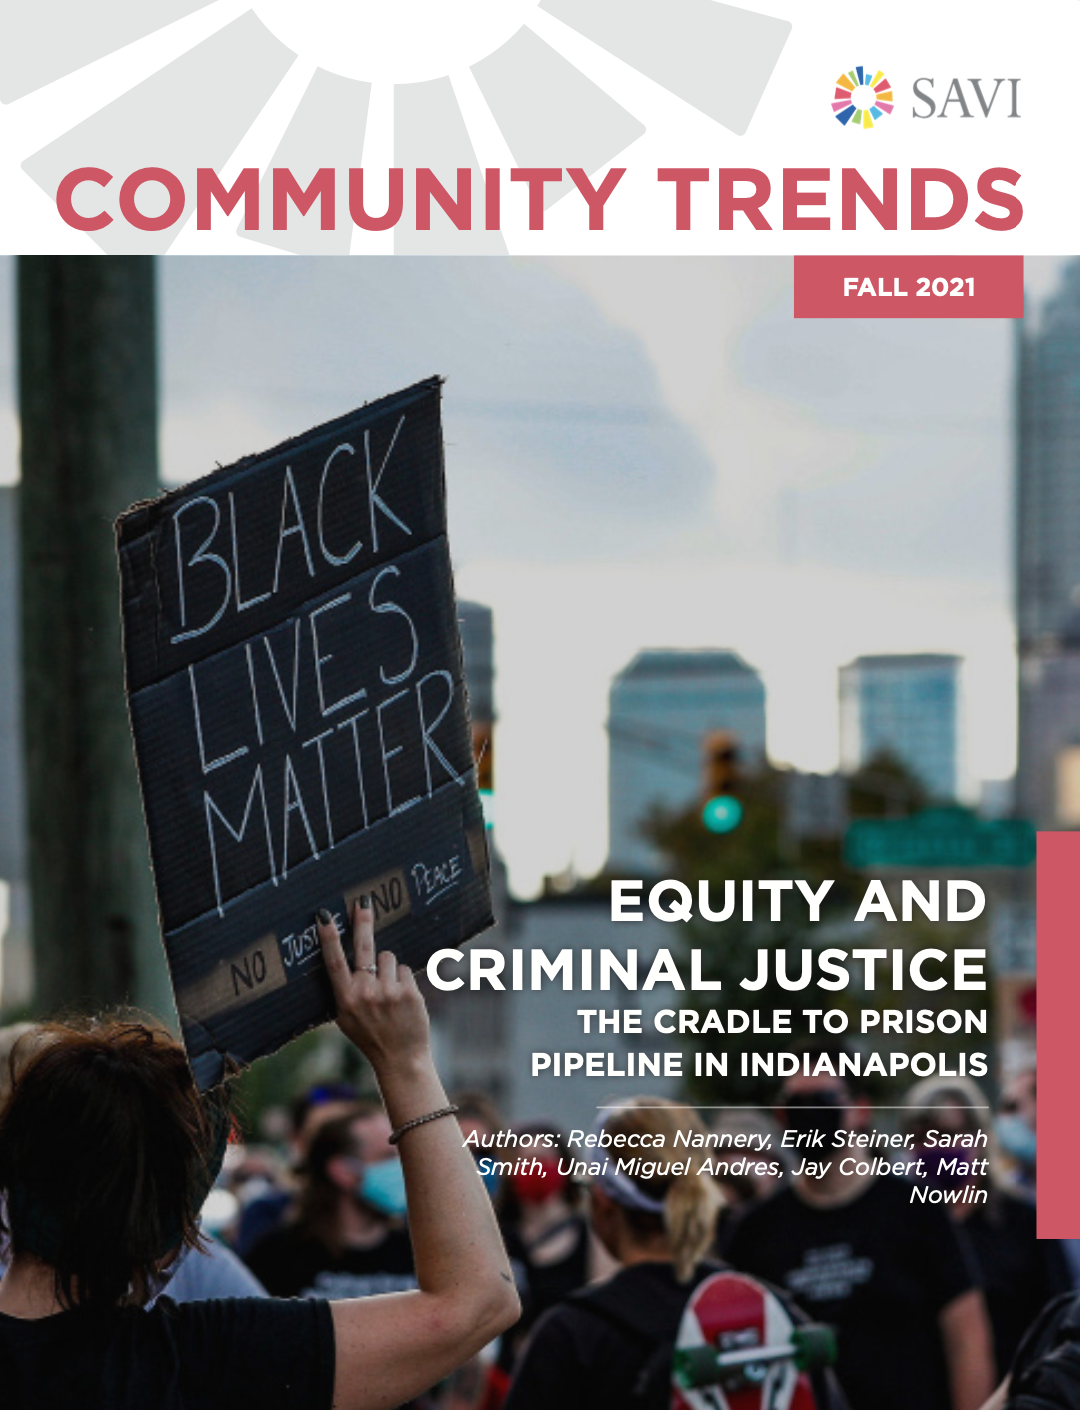
Equity and Criminal Justice
SAVI Talks - November 18, 2021An individual’s interaction with the criminal justice system is not necessarily a random event: Research shows that beginning from birth, various factors including disability, race, gender, and economic status result in disproportionate impact on subpopulations in a way that makes them more likely to engage with the criminal justice system. These factors, and policies that alleviate or compound existing inequities will be examined using the Cradle to Prison Pipeline framework.
This report examines a concept called the “cradle to prison pipeline.” It is a review of some of the basic statistics at each stage of this pipeline: childhood, school, juvenile justice, early adulthood, and imprisonment. For each stage, we present basic trends and disparities across race, place, gender, and other demographic variables.
Research has shown that highlighting racial disparities can actually increase support for policies that perpetuate inequality, such as “stop and frisk.” With caution, this report maintains a focus on disparities, particularly between Black and white residents, because those are indicative of problems within systems and not the inherent criminality of individuals or populations.
Black and white jail population per 100,000 people age 15-64 (five-year average)
Indiana
Marion County
Community Trends Report
SAVI Talks Presentation
Introduction & Report Presentation:
Panel Discussion & Closing Remarks:
Articles and Story Maps
Explore other research and interactive content we have developed around equity.
Who is in the Marion County Jail? Exploring Length of Stay through an Equity Lens
We analyzed more than 283,000 bookings into Marion County’s jails between 2013 and 2021 to discover how many people are in jail, the characteristics of those in jail, and how long people remain in jail. This dataset spans nine years. In that time, state laws changed...
The State of Tenants in Central Indiana
Indiana Senate Bill 230 would have required landlords to make necessary repairs to their properties. We examine the renters impacted by the bill’s failure.
Modern Redlining in Indianapolis?
Our analysis of one million loan applications since 2007 shows that, even when income and debt are the same, having a Black applicant on the loan increases the odds of being denied by 2-3X, and applying for a loan in a historically redlined neighborhood increases the odds of denial by 50 percent.
A Deep Dive into Affordable Rental Housing
New data shows the number of subsidized rental homes in Marion County is stagnant, while the need for units affordable to extremely low-income households is large.
Our Changing City, Block by Block
From suburban growth to revitalization and displacement, regional change is driven by block-to-block changes. These maps are the most detailed information available from the 2020 census.
Equity and Criminal Justice: The Cradle to Prison Pipeline in Indianapolis
This report examines a concept called the “cradle to prison pipeline.” It is a review of some of the basic statistics at each stage of this pipeline: childhood, school, juvenile justice, early adulthood, and imprisonment. For each stage, we present basic trends and...
Worlds Further Apart
In our updated analysis of 104 ZIP Codes in the metro area (2014-2018), we identified the northern suburb of Fishers as our longest living community and just 17 miles away, within the Indianapolis city limits, is the shortest living community within the metro area....
The Lasting Impacts of Segregation and Redlining
80 years after the federal government encouraged lenders to consider “neighborhood characteristics” like race in their lending decisions, redlining and segregation have a measurable impact on economic opportunity, health outcomes, the environment, and violence.
Equity in Economic Opportunity: How Race, Place, and Class Impact Economic Mobility in Indianapolis
Children born to low-income families in Indianapolis in the 1980s grew up to earn less than their peers in almost any other large city. The ability of children to move above the economic status of their parents is influenced by the parents’ income, demographics, and...
Animated Map of New U.S. COVID-19 Cases Over Time
The incidence of new COVID-19 cases has not been the same over time throughout the country. This animated map shows the 7-day average of new COVID-19 cases per 100,000 people. This allows us to view the spread and incidence of the virus regardless of population...
Authors
Sharon Kandris
Associate Director,
The Polis Center
Jay Colbert,
Data Manager,
The Polis Center
Jeramy Townsley,
Visiting Research Analyst,
The Polis Center
Matt Nowlin,
Research Analyst,
The Polis Center
Event Partners


