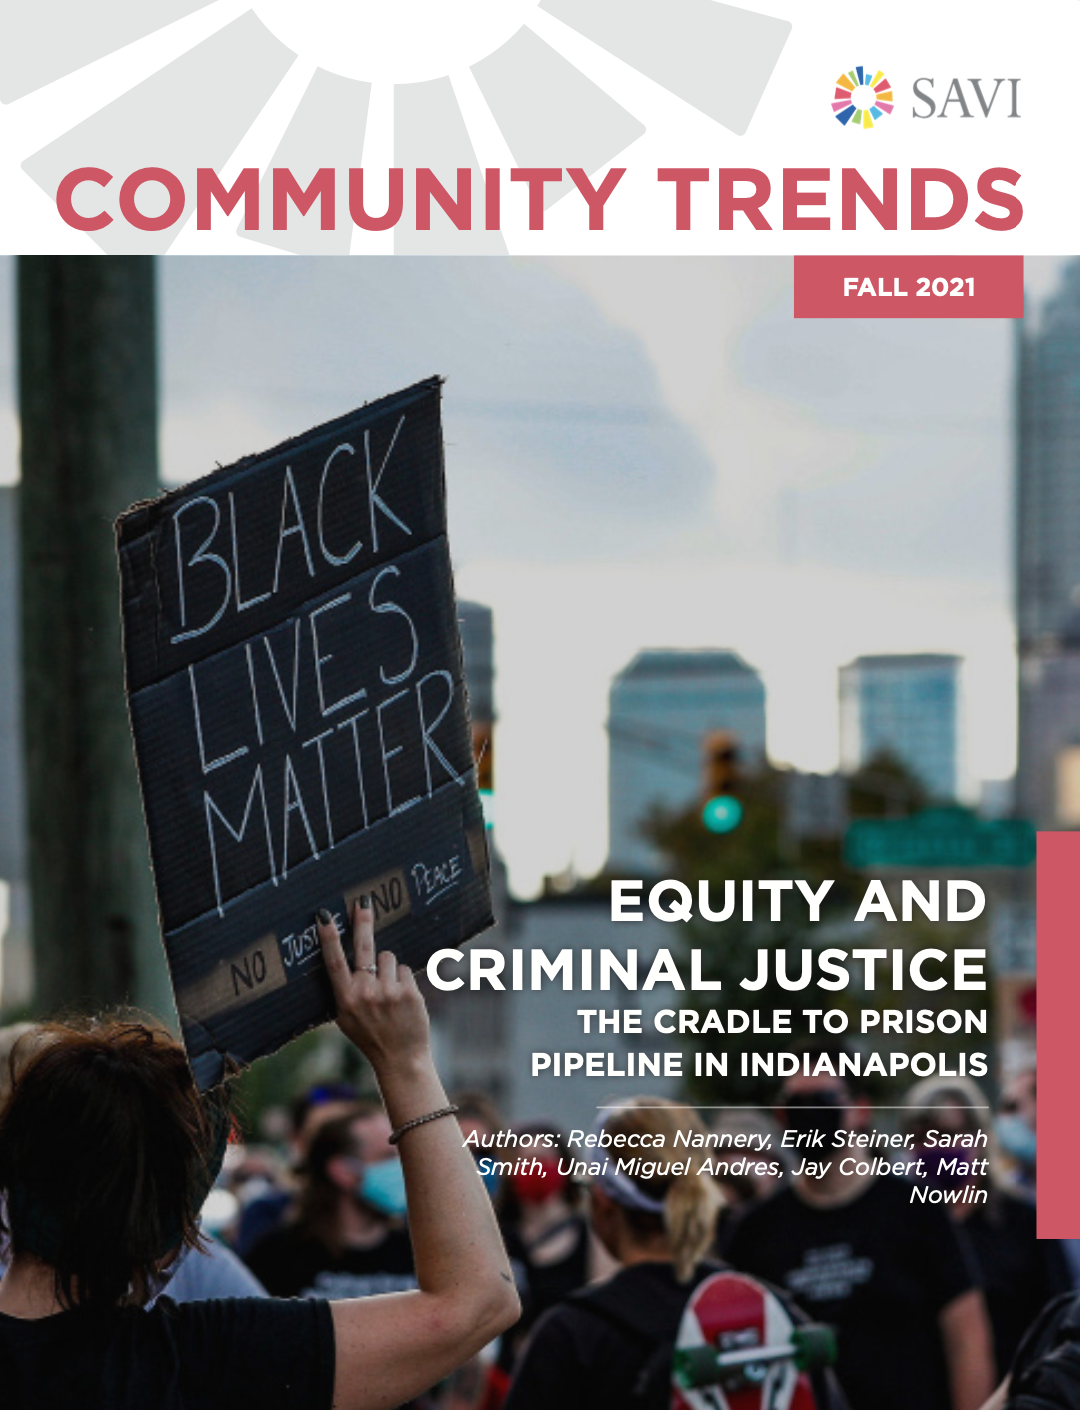
Equity and Criminal Justice
SAVI Talks - November 18, 2021An individual’s interaction with the criminal justice system is not necessarily a random event: Research shows that beginning from birth, various factors including disability, race, gender, and economic status result in disproportionate impact on subpopulations in a way that makes them more likely to engage with the criminal justice system. These factors, and policies that alleviate or compound existing inequities will be examined using the Cradle to Prison Pipeline framework.
This report examines a concept called the “cradle to prison pipeline.” It is a review of some of the basic statistics at each stage of this pipeline: childhood, school, juvenile justice, early adulthood, and imprisonment. For each stage, we present basic trends and disparities across race, place, gender, and other demographic variables.
Research has shown that highlighting racial disparities can actually increase support for policies that perpetuate inequality, such as “stop and frisk.” With caution, this report maintains a focus on disparities, particularly between Black and white residents, because those are indicative of problems within systems and not the inherent criminality of individuals or populations.
Black and white jail population per 100,000 people age 15-64 (five-year average)
Indiana
Marion County
Community Trends Report
SAVI Talks Presentation
Introduction & Report Presentation:
Panel Discussion & Closing Remarks:
Articles and Story Maps
Explore other research and interactive content we have developed around equity.
Indiana Geographic Information Council’s (IGIC) Special Achievement in GIS Award
The Polis Center won the Indiana Geographic Information Council’s (IGIC) Special Achievement in GIS Award for the SAVI Coronavirus Data Hub. IGIC President Kari Hicks says, “Given the impact of COVID-19, using GIS to create a dashboard to help inform...
Health and Economic Impact of COVID-19 on Neighborhoods
In this report, we identify the areas in Indianapolis most affected by COVID-19, particularly those already disproportionately affected by poverty; define some of the challenges families in these areas are facing; and explore ways inequity plays a role in the risk,...
Indy Evictions May Reach 34,000 or More in 2020
An increase in unemployment claims could drive the eviction rate from 7 percent in 2016 to 20 percent in 2020, and informal evictions may be twice that.
Police Used Force on 1.3 Percent of Black Residents Since 2015
Police used force over 1,600 times in 2019. Officers use force on black residents at a rate 2.6 times higher than white residents.
Socioeconomic factors explain why some New York ZIP codes were hit hardest by COVID-19
By comparing New York’s COVID-19 test results with demographic and socioeconomic factors by ZIP code, we found that low education levels, crowded housing, and a lack of health insurance are some of the strongest predictors of high COVID-19 positivity rates.
The Inequalities Behind COVID-19 Disparities for African Americans in Indianapolis
COVID-19 positivity rate is 1.8 times higher for blacks than for whites. We explore how systemic inequities put many black individuals at higher risk for getting the virus, having a serious case, and suffering from the economic impacts compared to white residents.
Three Ways to Visualize COVID-19 Race and Gender Disparities
In Indiana, black individuals are 2.4 times more likely to test positive than whites. We look at three different ways to visualize COVID-19 disparities like this.
How long does it take to get to a grocery in each neighborhood?
This past November, we released the report Getting Groceries: Food Access Across Groups, Neighborhoods, and Time. Expanding on this report, we created an interactive map to display food access information for each block group in Marion County. Click on a block group...
Getting Groceries
When people do not have access to healthy food, this can impact their diet, their health, and their quality of life. Food deserts are a way of defining communities that lack healthy food access. These are neighborhoods with both low healthy food access and low income....
After Expansion, Pacers Bikershare Offers Access to 34 Miles of Bike Trails
With the addition of 29 new bikeshare stations, Pacers Bikeshare now makes trips possible on one third of Indy’s bike trail system.
Authors
Sharon Kandris
Associate Director,
The Polis Center
Jay Colbert,
Data Manager,
The Polis Center
Jeramy Townsley,
Visiting Research Analyst,
The Polis Center
Matt Nowlin,
Research Analyst,
The Polis Center
Event Partners


