The Changing Landscape of Poverty
SAVI Talks - June 2019The poverty rate in Central Indiana has risen from 9% in 1970 to 14% in 2017, but the rates vary widely by neighborhood. How is poverty changing at the local level? Who is most affected by these changes?
Historically, poverty has been highest in core urban neighborhoods where, in 1970, one in six residents lived in poverty. Now that number is one in three. Poverty has grown the fastest in middle-ring suburbs where the rate has quadrupled from 5% in 1970 to 20% in 2017. Meanwhile, some neighborhoods, such as those built since 2000, have had consistently low rates of poverty and have experienced very little change in those rates.
The residents in each of these areas are different, and so is their experience of living in poverty. What challenges are unique to the very low income families in neighborhoods where poverty is high or climbing quickly?
Poverty in Indy Region and Our Peers

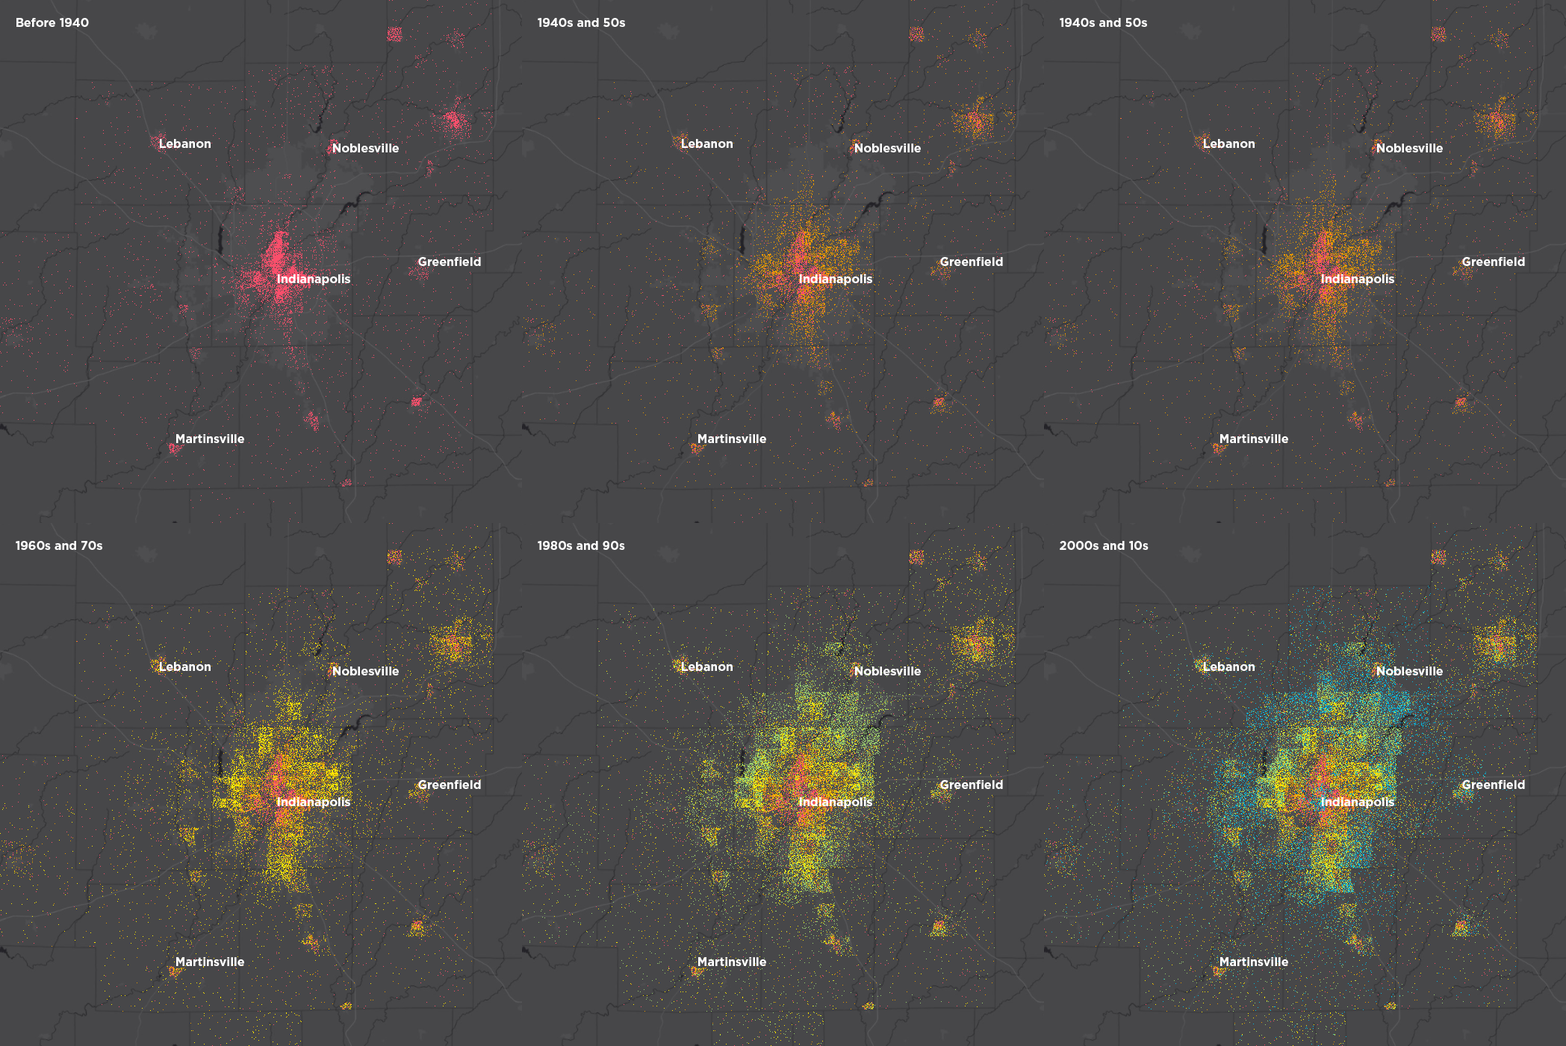
This map represents housing units colored by when they were built, from before 1940 to since 2000. By examining when housing units were built, we divide the region into development bands, or eras of development. Then we examine how poverty has shifted in those areas sine 1970.
Authors
Matt Nowlin,
Research Analyst,
The Polis Center
Unai Miquel Andres,
GIS and Data Analyst,
The Polis Center
Kelly Davila,
Senior Research Analyst,
The Polis Center
Event Partners


