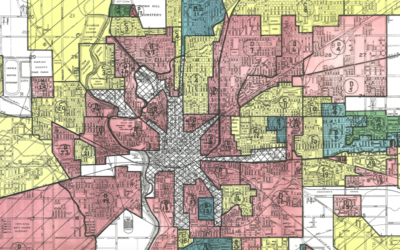
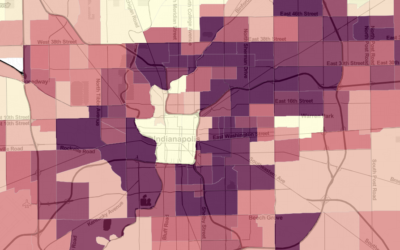
Our analysis of one million loan applications since 2007 shows that, even when income and debt are the same, having a Black applicant on the loan increases the odds of being denied by 2-3X, and applying for a loan in a historically redlined neighborhood increases the odds of denial by 50 percent.
Search Results
A Deep Dive into Affordable Rental Housing
New data shows the number of subsidized rental homes in Marion County is stagnant, while the need for units affordable to extremely low-income households is large.
Equity and Criminal Justice: The Cradle to Prison Pipeline in Indianapolis
Black Hoosiers are twice as likely to be jailed and 4.5 times as likely to be imprisoned as their white peers. However, these disparities exist long before an individual is imprisoned. From the place and situation into which a child is born, to the discipline and juvenile justice policies in their school and community, a person’s childhood experience influences their likelihood of being involved in the criminal justice system.
The Lasting Impacts of Segregation and Redlining
80 years after the federal government encouraged lenders to consider “neighborhood characteristics” like race in their lending decisions, redlining and segregation have a measurable impact on economic opportunity, health outcomes, the environment, and violence.
Health and Economic Impact of COVID-19 on Neighborhoods
We developed an index to quantify the pandemic’s health impacts and economic impacts on neighborhoods, as underlying vulnerabilities in those areas.
Indy Evictions May Reach 34,000 or More in 2020
An increase in unemployment claims could drive the eviction rate from 7 percent in 2016 to 20 percent in 2020, and informal evictions may be twice that.
The Inequalities Behind COVID-19 Disparities for African Americans in Indianapolis
COVID-19 positivity rate is 1.8 times higher for blacks than for whites. We explore how systemic inequities put many black individuals at higher risk for getting the virus, having a serious case, and suffering from the economic impacts compared to white residents.
How long does it take to get to a grocery in each neighborhood?
This past November, we released the report Getting Groceries: Food Access Across Groups, Neighborhoods, and Time. Expanding on this report, we created an interactive map to display food access information for each block group in Marion County. Click on a block group...
Michigan Street a Century Ago: A Neighborhood Node
Two miles east of downtown, Michigan Street is largely vacant. But in the early 20th century was a bustling corridor for the Willard Park and St. Clair neighborhoods. Discover the history and demographics of these blocks.
Increasing Mortgage Values
Mortgage values are increasing across the county, indicating an increase in housing prices. We explore the fastest changing areas, as well as places with very little little mortgage activity.