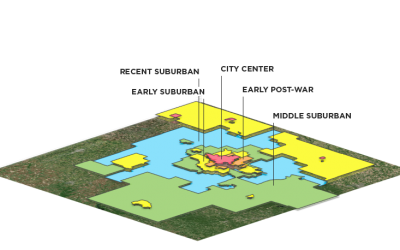
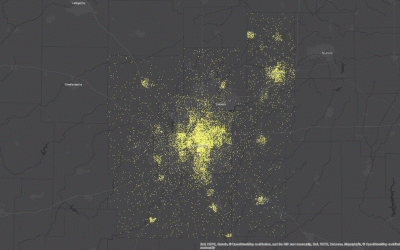
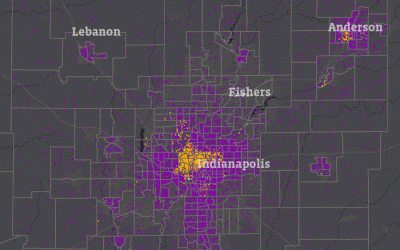
Using the age of housing stock in each neighborhood, we have created “development bands,” which group areas by the time period in which they were primarily built.
Search Results
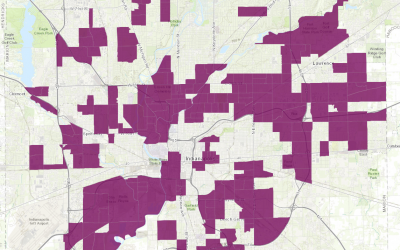
Estimated 200,000 Indy Residents Live in Food Deserts
Using recent, local data to improve on food access measures, we find that an estimated 200,000 Indianapolis residents have low food access and live in low income areas.
Where Schools Are Changing
Regionally, schools are becoming more racially diverse, have a growing share of low-income students, and have increasing graduation rates. Low-income student population is falling in central Indianapolis and growing in Marion County’s townships, pointing to a growing number of low-income families living in first-ring suburbs. Schools experiencing similar change tend to be grouped geographically, with rapidly changing schools in more urban areas, and those holding steady in racial and income change located in more suburban and rural areas.
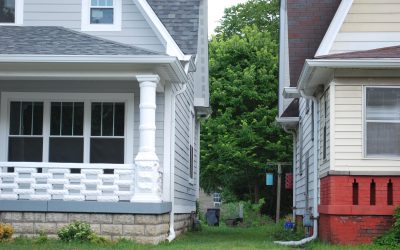
After Public Investment, St. Clair Place’s Housing Market Significantly Stronger
Mortgage activity in St. Clair Place shows a dramatic increase in home purchases and home value since 2007. The area is more diverse than ever and poverty is falling for people of color. But home buyers are still 76 percent white.
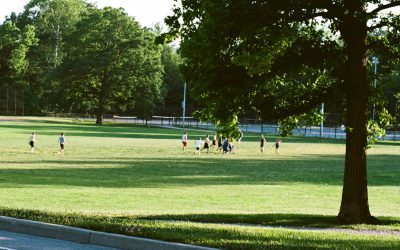
With New Park Planned in Fishers, How Do Parks Relate to Property Value?
Indy has 51 sq. meters of park per person, while Fishers has only 4.3 sq. meters per person. In some neighborhoods, properties close to parks are worth more, in some they are worth less. On average, property near parks is worth $5K less than others in that neighborhood.
Story Map: Moving Out – Suburbanization Since 1970
Indianapolis and Anderson were the region’s urban centers in 1970. Three-quarters of the population lived in those counties. Now, just over half the population live there, and Hamilton County is the second largest urban center.
Story Map: Race and Migration Since 1970
In 1970, half of the region’s Black population lived in 12 square miles north of downtown Indianapolis. As Black residents moved into ’60s suburban communities, 120,000 White residents left the city’s core for newer suburbs.
Behavioral Risk Factor Surveillance Survey (BRFSS)
It is the nation's premier system of health-related telephone surveys that collect state data about U.S. residents regarding their health-related risk behaviors, chronic health conditions, and use of preventive services. See Data Source See Data Source
ArcGIS Online
Provides the availability of acquiring some basic data provided by ESRI (Demographic) as well as user updated data. See Data Source
5 Innovative Ways SAVI is Supporting Public Health
I’m pleased to introduce the health edition of SAVI Online, the second issue of our digital magazine. It features a few of the many ways SAVI is helping improve health in Indianapolis. 1. SAVI helps nonprofit be more strategic in health initiatives. For example, SAVI...

