by Polis Center | Apr 14, 2018 | Demographics
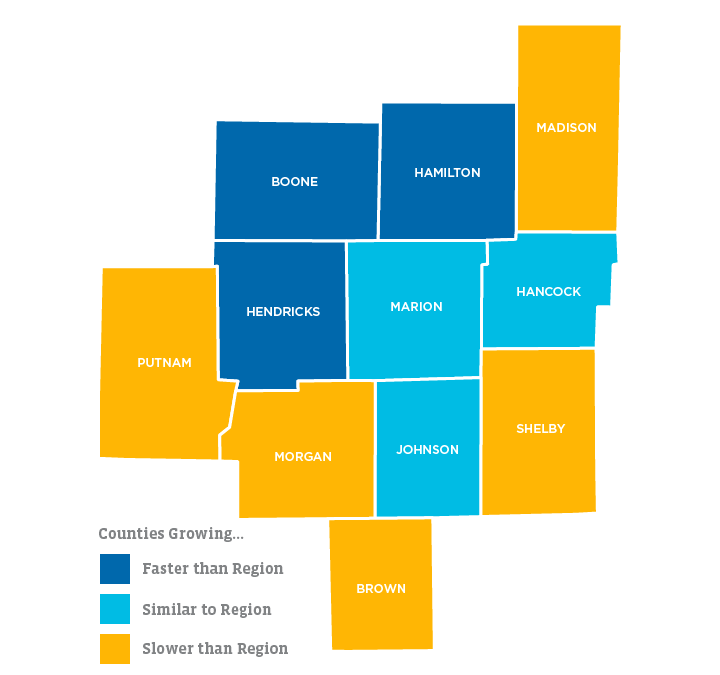
The Indianapolis region’s population grew by over 18,000 people from 2015 to 2016, according to the newest American Community Survey (ACS) results, published to SAVI in April. The region is now home to 1.97 million people, based on the 2016 ACS 5-Year Average....
by Polis Center | Jan 1, 2018 | Economy, Poverty & Income
Since 2007, the Indianapolis metropolitan statistical area’s average annual pay per employee has increased 16.3 percent, from $42,240 in 2007 to $49,126 in 2016, according to the Bureau of Labor Statistics’ Quarterly Census of Employment and Wages. (This...
by Polis Center | Nov 30, 2017 | Community Development, Economy, Poverty & Income
SAVI just published the latest data release (2016) from the Home Mortgage Disclosure Act (HMDA). Banks report lending activity by census tract, recording information about the loan and the borrower. We are going to dig into this data to find areas where mortgage...

by Jim Dowling | Oct 7, 2013 | Community Development, Demographics
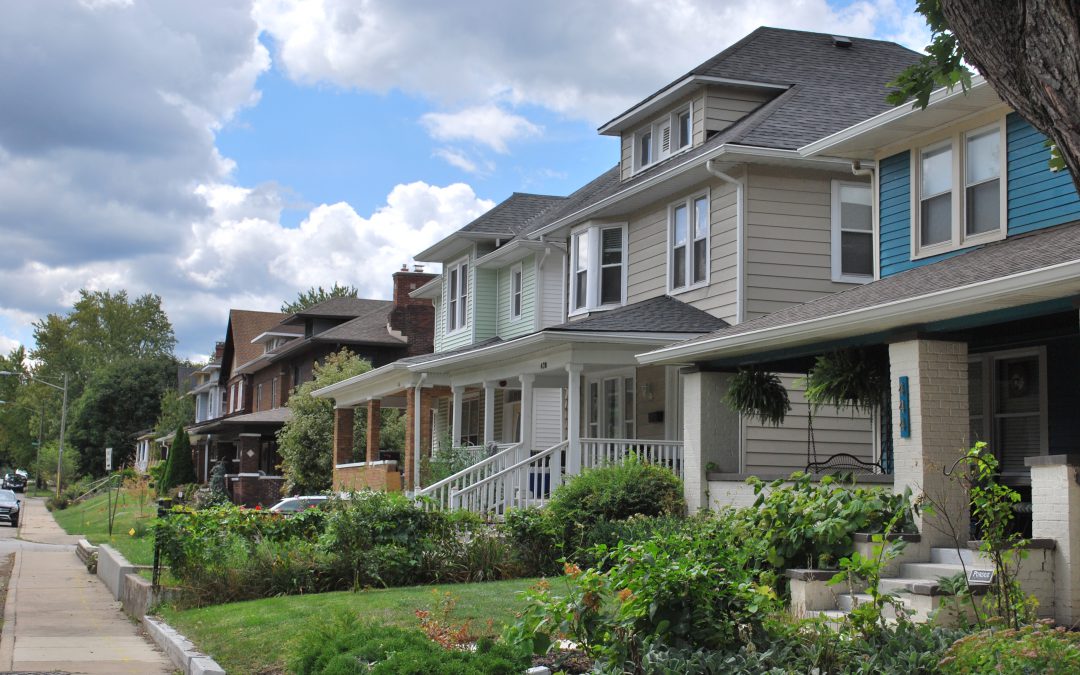
Changes in Owner Occupied Houses in the KI EcoCenter Area: Block Group Units Comparing 2000 and 2010 Census Data By Jim Scheurich, PhD A change over time in owner occupied houses is one way to examine whether a community is growing, remaining stable, or growing in...

by Polis Center | Jun 20, 2013 | Poverty & Income
As you’re probably aware from recent news reports, Feeding America recently released its annual Map the Meal Gap report, with statistics on the state of hunger across the nation. According to its report, food insecurity (not always knowing where your next meal will...
 Where You Live Matters: Exploring Community Health and Risk Factors in Central IndianaIn HealthMarch 21, 2025
 Indianapolis Racial Equity Report CardIn UncategorizedSeptember 3, 2024