Where You Live Matters | March 2025
Exploring Community Health and Risk Factors in Central Indiana
S M Asger Ali, Ally Scott, Jay Colbert, and Sharon Kandris
What You’ll Find in This Report
Data About:
- Health outcomes such as:
- Life Expectancy
- Leading Causes of Death
- Poor Mental and Physical Health
- Social and environmental risk factors such as:
- Income, Poverty, and Health Insurance
- Communities with poor health and high-risk
Key Findings
- The leading causes of death in Central Indiana’s eleven-county region closely mirror national trends, with heart disease and cancer consistently ranking as the top two.
- In 2022, Hamilton County (81.0 years) has the highest life expectancy at birth, whereas Madison and Marion counties (73.8 years) have the lowest.
- In 2022, Hamilton County ($114,866) has the highest median income, while Marion County ($59,504) has the lowest median income. The difference between the highest and lowest median incomes is $55,362, showing significant variation across counties located in Central Indiana.
- In Central Indiana, Madison County (26%) and Marion County (25%) have the highest Medicaid enrollment, suggesting a greater proportion of residents with lower incomes or limited access to private insurance.
- Marion County, the most urbanized county in the region, has a relatively high number of poor mental (18.1%) and physical (13.7%) health days reported by adults (aged 18+). In contrast, suburban counties like Boone and Hendricks show better health metrics.
- The census tracts with the worst health outcomes and highest risk factors are mostly located in the urban areas of Marion and Madison counties (Anderson), with a few located in rural areas. In Marion County, the most affected neighborhoods are in the older suburbs just outside of downtown.
Background
Where you live is more than just a place—it reflects your culture, community, and identity. Our living environment shapes our health and wellness through access to healthcare, employment opportunities, education, housing quality, safety, and the living environment. Living in a high-poverty area is associated with high mortality rates, low birth weight, coronary heart disease, and childhood asthma.1 At the same time, racial segregation exacerbates socioeconomic disparities and contributes to health issues such as life expectancy, infant mortality, and tuberculosis.2 For example, in Marion County, Black residents have the lowest life expectancy and highest infant mortality (infant deaths per 1,000 live births) compared to white, Hispanic, and Asian residents.3 Environmental stressors further worsen health conditions in disadvantaged communities, including targeted marketing of tobacco and alcohol, high crime rates, limited access to fresh food, and inadequate healthcare facilities.4 Economic instability also makes it difficult for individuals to afford essential healthcare, often leading to not attending doctor visits to avoid co-pays or skipping necessary medications due to high costs.5
This article compares health indicators with socioeconomic and environmental health risk factors in Central Indiana. We use advanced data visualization techniques to examine health outcomes and risk factors across counties, highlighting disparities by race and geography. While the primary focus is on the most recent data, trends over time are also explored when relevant. Additionally, key variables are mapped at the census tract level to identify areas with both favorable and adverse health outcomes and risk factors.
Objectives
- Examine health in neighborhoods in Central Indiana by exploring the geographic pattern of selected health outcomes and risk factors utilizing publicly available datasets and online data visualization tools.
- Identify neighborhoods with poor health outcomes and high risk (scores in the bottom 10%) based on selected health and well-being indicators.
Geography
This report defines Central Indiana as comprising eleven counties: Boone, Brown, Hamilton, Hancock, Hendricks, Johnson, Marion, Madison, Morgan, Putnam, and Shelby. These counties exhibit varying levels of urbanization. Marion County (Indianapolis), along with Hamilton and Johnson counties, are highly urbanized, featuring substantial suburban and metropolitan development. Boone, Hancock, Hendricks, Madison, and Morgan counties present a mix of urban centers and rural landscapes. In contrast, Brown and Putnam counties are largely rural, with only small, urbanized areas.

Health Outcomes
Life Expectancy at Birth
Life expectancy at birth represents the average number of years a person is expected to live and is shaped by factors such as healthcare access, living conditions, and socioeconomic status. Disparities in these factors contribute to significant differences in life span across communities.6 A 2015 SAVI article, Gaps in Life Expectancy in the Indianapolis Metro Area,7 illustrates this stark contrast: despite being only 28 miles apart, a northeastern suburb of Indianapolis had a life expectancy of 83.7 years, while a community in the urban core just south of Monument Circle had only 69.4 years. Among the 11 counties in Central Indiana, Hamilton County had the highest life expectancy (82.0 years), while Madison County had the lowest (76 years). Although the study was conducted nearly a decade ago, recent data show similar trends across counties. For instance, in 2022, Hamilton County had the highest life expectancy (81.0 years), whereas Madison and Marion counties remained the lowest (73.8 years). In addition, from 2013-2022, every Central Indiana county saw a drop in life expectancy, with Marion (-2.6 years) and Madison (-2.2 years) experiencing the largest declines. This decline may have resulted from the impact of COVID-19, lack of access to healthcare, and pre-existing socioeconomic disparities.8
Leading Causes of Death
The leading causes of death in Central Indiana’s eleven-counties closely mirror national trends, with heart disease and cancer consistently ranking as the top two. Mortality rates in these counties have remained relatively stable over the years. Over time, mortality rates for chronic lower respiratory disease and stroke (cerebrovascular disease) have shown slight declines, while rates for Alzheimer’s disease have remained relatively steady.
COVID-19 significantly impacted mortality rates, ranking as the third-highest cause of death from 2020 to 2022. COVID-19 mortality peaked at 114 deaths per 100,000 residents in 2020, declining to 98 in 2021 and 51 in 2022. Despite this temporary shift, heart disease and cancer remained the leading causes of death even during the height of the pandemic, underscoring the persistent public health burden.
Heart disease and cancer remain the leading causes of death across all eleven counties in Central Indiana, though rates vary by location. Heart disease mortality per 100,000 people is highest in Putnam (190), Morgan (187), and Johnson (184) counties, highlighting a need for targeted cardiovascular health interventions. Cancer mortality follows a similar trend, with the highest rates in Putnam (177), Morgan (173), and Madison (170) counties. Madison and Hancock counties have the highest for chronic lower respiratory disease and stroke, which have been linked to risk factors such as smoking prevalence, environmental exposures, and healthcare access disparities.9 Alzheimer’s disease mortality rates vary moderately, with the highest rates in Johnson (38), Hendricks (36), and Shelby (36) counties.
Physical and Mental Health
Physical and mental health are crucial in shaping quality of life and well-being. Strong physical health enhances energy levels and lowers the risk of severe illnesses, while poor physical health can limit mobility, independence, and overall well-being.10 Poor mental health affects cognitive functions and the ability to build and maintain meaningful relationships, influencing overall life satisfaction.11 Data from CDC Places indicate that around 18.3% of adults in Shelby County suffer from more than 14 poor mental health days per month, and 15.1% of adults suffer from more than 14 poor physical health days per month. Marion County, the most urbanized county in Central Indiana, also experiences relatively high rates of poor mental (18.1%) and physical (13.7%) health days compared to its surrounding suburbs. Most surrounding counties, like Boone and Hendricks, report better health metrics, with Hamilton County as the lowest rate in Central Indiana.
Source: CDC Places, 2022 via SAVI Community Information System
Socio-Economic Health Risk Factors
Median Household Income
All Central Indiana counties experienced income growth between 2018 and 2022, though at varying rates across the region. Hamilton County remains the highest-income county, increasing 21% from $94,644 to $114,866. As a comparison, the cumulative inflation rate over that time would have been roughly 17.5%, so incomes in general kept up with or surpassed inflation. Boone County, the second wealthiest, saw a 28% increase, from $80,567 to $103,038, while Hendricks followed with a 22% rise from $78,355 to $95,261. Lower-income counties also experienced steady increases, though their income levels remained significantly lower. Marion and Madison, the region’s lowest-income counties, saw income growth of 27% each, rising from $46,682 to $59,504 in Marion and from $47,436 to $60,060 in Madison.
Despite the overall increase in median income, significant income disparities persist by race and ethnicity. For example, in Centra Indiana, the Black-white income gap widened by 22% from -$31,131 in 2018 to -$37,968 in 2022, highlighting the persistent income disparity faced by Black households. Similarly, the Hispanic-white income gap shrunk by 17% from -$24,650 in 2018 to -$20,324 in 2022, reflecting faster income growth among Hispanic households compared to Black households.
A similar pattern emerges in Marion County, where income disparities between white and Black, as well as white and Hispanic residents, persisted from 2018 to 2022. The Black-white income gap grew by 26% from -$23,171 in 2018 to -$29,172 in 2022, underscoring the consistently lower earnings of Black households. Meanwhile, the Hispanic-white income gap decreased by 25% from -$20,326 in 2018 to -$15,276 in 2022, indicating some relative improvement in Hispanic household income compared to white households.
Poverty
The visuals highlighting poverty rates by race reveal disparities in Central Indiana and Marion County. The poverty rate decreased nearly 40% among Hispanic residents, the largest decline from 2018 to 2022, resulting in a significant reduction in the gap between Hispanic and white residents. The gap for Black residents and other demographic groups remained nearly the same.
Counties like Madison and Marion, which have historically struggled with high poverty rates, show persistently high numbers for residents, despite slight declines over time. This suggests that systemic economic challenges, such as job accessibility, wage stagnation, and affordable housing shortages, continue to impact these populations disproportionately. Meanwhile, the poverty rate for white residents has remained relatively stable in both Marion County and the Indianapolis Metropolitan Area, reflecting the racial disparities in economic hardship. The visuals reveal how poverty in Central Indiana is not evenly distributed, with minority communities facing greater financial instability, which may lead to increased migration, limited economic mobility, and long-term impacts on education, housing, and health outcomes.
Education
There are disparities in educational attainment across racial groups in Central Indiana, which are likely to contribute to broader economic inequality in Central Indiana. Hispanic residents consistently show the highest rates of individuals without a high school diploma, and while there have been slight declines over time, these persistently high numbers suggest systemic barriers to education, such as language barriers, financial hardship, and limited access to educational support systems.
These educational disparities have direct consequences on poverty rates and economic mobility. A lack of a high school diploma significantly limits job prospects, often leaving these individuals to pursue low-wage jobs with little room for advancement.12 This is especially concerning in counties where both poverty rates and educational non-attainment rates remain high. The relatively lower and stable rates for white populations across most counties suggest that economic and educational barriers disproportionately affect minority communities. Without increased access to educational resources, job training, and social support systems, these trends likely will continue to reinforce cycles of poverty and limit economic opportunities for marginalized groups in Central Indiana.13
Population Living in the Food Desert
Food deserts are geographic areas where residents lack access to affordable, healthy food options, particularly fresh fruits and vegetables, due to the absence of grocery stores within a reasonable distance.14 Food deserts are mostly in low-income areas where access to cars or private transportation is limited. Research on food deserts has shown that areas with higher incomes can have upwards of three times more grocery stores compared to areas with lower incomes, and neighborhoods that are predominantly white have four times more grocery stores compared to neighborhoods that are predominantly Black. 15
In Central Indiana, Shelby County (21%) and Marion County (15%) have the highest percentage of residents living in a food desert. In contrast, nearly all other counties have fewer than 10% of their residents living in a food desert, especially Boone County (less than 1%). Black residents in Central Indiana are more likely to live in a food desert than white or Asian residents, and the same can be seen in Marion County.
Medicaid Enrollment
The percentage of the population enrolled in Medicaid varies across Central Indiana counties, reflecting differences in healthcare access, socioeconomic status, and insurance coverage. Madison County (26%) and Marion County (25%) have the highest Medicaid enrollment, suggesting a greater proportion of residents with lower incomes or limited access to private insurance.Marion County (9.4%) also has a higher percentage of the population without health insurance, followed by Madison County (7.6%).³ Morgan (16%), Shelby (19.5%), and Johnson (14.2%) counties also report relatively high Medicaid enrollment compared to the regional average. In contrast, Hamilton County (7%) and Boone County (9%) have the lowest enrollment rates, likely due to higher income levels and greater access to employer-sponsored insurance. These disparities highlight the need for targeted healthcare policies to improve coverage and access for vulnerable populations.
Access to Healthcare: Primary Care Physicians (PCP), Dentists, and Mental Health Providers (MHP)
In Central Indiana, access to healthcare services is disproportionate across the region. For instance, Brown and Putnam Counties have the fewest Primary Care Physicians (PCPs), with only 32 per 100,000 residents, compared to Boone County with 211 and Hamilton County with 139.
There is a gap in primary care access for those counties reporting the worst physical health. For example, Morgan County has the third highest percentage of people reporting poor physical health yet has the worst access to primary care physicians. Shelby County has the highest percentage of people reporting poor physical health days yet has the third worst access to PCPs.
When it comes to dental care, the counties with the lowest income tend to have a higher dentist-to-population ratio than their PCP ratio, including Putnam, Shelby, Morgan, Madison, and Marion counties. Marion County leads with 94 dentists per 100,000 residents, followed by Hamilton County (74), while Brown County has the lowest availability (6).
Access to mental health providers (MHPs) is higher than PCPs and dentists in every county except Boone. Marion County, being the most urban, has the highest concentration of MHPs (365 per 100,000 residents), followed by Hamilton and Madison counties. In contrast, more rural counties, such as Brown and Morgan counties, have the lowest number of MHPs.
Overall, Central Indiana counties with poorer mental health tend to have higher access to mental healthcare facilities. However, exceptions exist, such as Morgan and Putnam counties, which have the second worst mental health outcomes while ranking in the lowest and second lowest tiers for access to mental health providers.
Healthcare shortages contribute to longer wait times, reduced access to specialized services, and increased strain on the existing healthcare system.16 Rural counties, in particular, may experience greater difficulties in receiving timely and comprehensive care, further widening the gap in health outcomes across Central Indiana.
Neighborhoods with Poor Health and High Risk (Bottom 10%)
We used census tracts to identify neighborhoods in Central Indiana with the worst health outcomes and elevated risk factors due to overlapping social, economic, and environmental conditions.
We used a three-step approach to determine these vulnerable areas:
- Selection of Indicators – We identified nine key health outcomes, and ten socio-economic and environmental risk factors based on existing literature and available tract-level data.
- Data Processing and Scoring – We assigned every census tract a binary value (1 or 0) for each indicator to state whether it is in the bottom 10% for the indicator. For example, tracts in the bottom 10% for a given risk factor, such as poverty rate, received a score of 1, while all others received a score of 0. This process was repeated for all selected health outcomes and risk factors. Then, we calculated two cumulative scores, one for health that adds the scores for the nine health indicators, and one for risk that adds the scores for the ten risk factors.
- Mapping and Visualization – We used ArcGIS to map and visualize the distribution of the scores. Health outcome scores range from 0 to 9, and risk scores range from 0 to 10. To identify the most vulnerable neighborhoods, we selected the census tracts that scored four or higher on both.
Indicators of Health Outcomes:
- Cancer
- Chronic Obstructive Pulmonary Disease (COPD)
- Stroke
- Heart Diseases
- High Blood Pressure
- Asthma
- Diabetes
- Poor Mental Health Days
- Poor Physical Health Days
Indicators of Socioeconomic and Environmental Health Risk Factors:
- Below Poverty
- Median Household Income
- Less than a High School Diploma
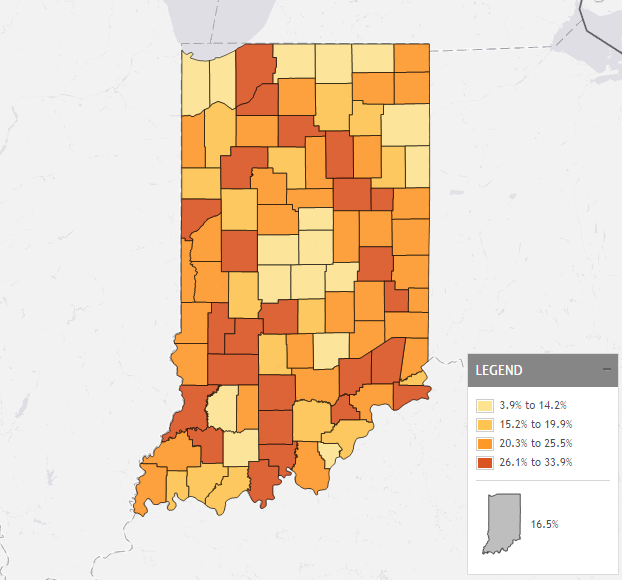
- Smoking
- Lack of Emotional Support
- Not Having Enough Food
- Housing Cost Burden
- Obesity
- No leisure time Activity
- Lack of Health Insurance
Bottom 10% Tracts with Worse Health Outcome and High Health Risk Factors
Out of 475 census tracts in Central Indiana, 148 tracts score in the worst 10% for at least one of the nine health outcomes, while 200 tracts score in the worst 10% for at least one of the ten health risk factors. The health outcomes maps (left) indicate that areas with the highest scores (red and purple) are primarily concentrated in Marion County (Indianapolis), especially neighborhoods in the central and northeast parts of the county. On the other hand, the high health risk factors map (right) highlights census tracts with high socioeconomic and environmental risk factors contributing to poor health. The clusters of tracts with high risk factors have a similar pattern in Indianapolis as the health outcomes map, particularly in the northeast area.
The figure below consists of two side-by-side maps of Central Indiana highlighting census tracts with worse health outcomes (left map) and high health risk factors (right map). Each map categorizes census tracts into high to low rankings, with darker colors indicating more severe health disparities and risks.
Source: Polis Center Analysis of Data from CDC Places, 2022 via SAVI Community Information System
Narrowing the Most Vulnerable Areas
In addition to looking separately at the bottom 10% for poor health and high risk, we identified the most vulnerable areas in Central Indiana by finding the intersection of the two scores. Thirty-one census tracts scored four or higher in both poor health outcomes and high health risk factors. These tracts represent the highest concentration of health disparities and are primarily clustered into two distinct zones:
1) Indianapolis (Marion County)
Location of high-risk/worse outcomes tracts:
- Near Eastside (Brightwood, Martindale-Brightwood, Brookside, Englewood)
- Near Westside (Haughville, Hawthorne, Stringtown, Riverside)
- Northeast (Cumberland, Warren Township, Lawrence)
- Southside (Fountain Square, Garfield Park, Bean Creek)
2) Anderson (Madison County)
Location of high-risk/worse outcomes tracts:
- Westside (W 9th St., 12th St., Arrow Ave)
- Downtown Anderson (Brown St., Fairview St., Fletcher St., Noble St., Meridian St.)
Source: Polis Center Analysis of Data from CDC Places, 2022 and American Community Survey, 2022 via SAVI Community Information System
Comparing Race and Social Vulnerability of High Risk/Worse Outcome Areas
We compared race and four common social vulnerability indicators in areas of Central Indiana with high health risks/worse outcomes against the region’s overall averages. We found notable racial disparities. In high-risk areas, 53% of residents are Black, while only 15% of the overall population in Central Indiana is Black. Similarly, 16% of residents in the high-risk/worse outcome areas are Hispanic, while 7% of the region-wide population is Hispanic. Since social vulnerability indicators were used to define the high-risk areas, we expect those to be worse for the high-risk areas than the rest of the region. The chart below shows the gaps between the high-risk areas and the rest of the region, with the biggest gap in poverty (53% compared to 11%) and population with a disability (21% compared to 13%).
Conclusion
This report provides a comparative analysis of health outcomes alongside socioeconomic and environmental health risk factors. Our findings reveal a clear pattern: counties with lower risk factors tend to have better health outcomes, while those with higher risk factors face greater health challenges. For instance, high-income counties such as Hamilton, Boone, and Hendricks consistently ranked higher in key health metrics, including life expectancy and overall mental and physical health, while also exhibiting stronger socioeconomic conditions. Conversely, lower-income counties like Marion and Madison ranked lower in the health matrix, reflecting higher poverty rates, lower incomes, and reduced access to healthcare services.
The analysis of the bottom 10% underscores that health disparities in Central Indiana are concentrated primarily in urban low-income neighborhoods and rural areas with limited healthcare access. These findings highlight geographic disparities that suggest the need for targeted response. For example, expanding Federally Qualified Health Centers (FQHCs) in high-risk areas would provide affordable preventive care and treatment to those with limited healthcare access.
Data Sources
Table 1: List of all Indicators by Source, Year and Geography
| Theme | Indicators | Description | Source and Year | Geography |
| Life Expectancy | Life Expectancy | Life Expectancy at Birth | National Center for Health Statistics 2019-2022 via County Health Ranking | County |
|
Leading Causes of Death
|
Top Causes of Death | Age-adjusted mortality rate per 100,000 | CDC Wonder, 2018-2023 | County |
| Chronic Disease | Cancer | Percentage of the population aged 18 years and older with Cancer (Non-Skin Cancers or Melanoma) | CDC Places 2022 via SAVI | Census Tract |
| Heart Disease | Percentage of the population aged 18 years and older with High Blood Pressure | |||
| Stroke | Percentage of the population aged 18 years and older who have ever had a Stroke | |||
| Diabetes | Percentage of the population aged 18 years and older with Diabetes | |||
|
Chronic Lower Respiratory Diseases (COPD)
|
Percentage of the population aged 18 years and older who have ever been diagnosed with Chronic Obstructive Pulmonary Disease, Emphysema, or Chronic Bronchitis | |||
| Asthma | Percentage of the population aged 18 years and older with Asthma | |||
|
High Blood Pressure
|
Percentage of the population aged 18 years and older with High Blood Pressure | |||
| Poor Physical and Mental Health | Poor Physical Health Days | Percentage of the population aged 18 years and older reporting more than 14 Poor Physical Health Days per Month | CDC Places, 2022 via SAVI | Census Tract |
| Poor Mental Health Days | Percentage of the population aged 18 years and older reporting more than 14 Poor Mental Health Days per Month | |||
| Social and Environmental Risk Factors | Poverty Rate | Percentage of the population with income below the poverty level (Population in poverty as a % of Population for whom poverty status is determined) | The American Community Survey (ACS) 2022 via SAVI | Census Tract |
| Population without Health Insurance | Percentage of the population without health insurance (Population without Health Insurance as a % of the Total Population) | |||
| Median Household Income | The median income of households: the amount at which half of the households in the area have more income and half have less income. | |||
| No High School Diploma | Percentage of the population aged 25 years and older whose Highest Level of Educational Attainment is Less Than a High School Diploma . | |||
| Housing Cost Burden | Percentage of Households that spend more than 30% of income on housing | |||
| Lack of Emotional Support | Estimated percentage of the population aged 18 years and older with a lack of social and emotional support | CDC Places, 2022 via SAVI | ||
| Food Insecurity | Percentage of the population aged 18 years and older reporting not having enough food or money to buy more at some point during the past 12 months | |||
| Smoking | Percentage of the population aged 18 years and older who report smoking every day or most days and having smoked at least 100 cigarettes. | |||
| Obesity | Percentage of the population aged 18 years and older who report a body mass index greater than or equal to 30kg/m2 | |||
| No Leisure Time Physical Activity | Percentage of the population aged 18 years and older who report no leisure-time physical activity during the past month | |||
| Medicaid | Share of the population receiving Medicaid | Civilian Noninstitutionalized Population with Medicaid Coverage as % of Civilian Noninstitutionalized Population | The American Community Survey (ACS), 2022 via SAVI | Census Tract |
| Availability of Healthcare service | Primary Care Physicians | Primary Care Physicians per 100,000 residents | Area Health Resource File/American Medical Association, 2021 via County Health Ranking | County |
| Dentists per 100,000 residents | Dentists per 100,000 residents | Area Health Resource File/National Provider Identifier Downloadable File via County Health Ranking | ||
| Mental Health Providers | Mental Health Providers per 100,000 residents | CMS, National Provider Identification, 2023 via County Health Ranking |
Acknowledgments
Contributors: Alli Kraus, Kayla Duncan, Harish Gadde, Bonnie VanDeventer, and Katharine Brunette.
")
Endnotes
- Social Determinants of Health—Healthy People 2030 | odphp.health.gov. (n.d.). Retrieved from https://odphp.health.gov/healthypeople/priority-areas/social-determinants-health
- Acevedo-Garcia, D. (2000). Residential segregation and the epidemiology of infectious diseases. Social science & medicine, 51(8), 1143-1161.
- The Polis Center. (2024). Equity report card – Health. SAVI. Retrieved March 7, 2025, from https://www.savi.org/equity-report-card/#health
- Silva, A. (2006). Where You Live Matters to Your Health. AMA Journal of Ethics, 8(11), 766–770. https://doi.org/10.1001/virtualmentor.2006.8.11.msoc1-0611
- ChenMed. (n.d.). How Do Social Determinants of Health Affect Care Outcomes? ChenMed. Retrieved from https://www.chenmed.com/blog/how-do-social-determinants-health-affect-care-outcomes
- Adler, N. E., & Stewart, J. (2010). Health disparities across the lifespan: meaning, methods, and mechanisms. Annals of the New York Academy of Sciences, 1186(1), 5-23.
- Weathers, T., Kiehl, N. T., Colbert, J. T., Nowlin, M., Comer, K. F., & Staten, L. K. (2021). Worlds Further Apart: The Widening Gap in Life Expectancy among Communities of the Indianapolis Metropolitan Area.
- The Polis Center. (2023). State of Aging in Central Indiana – Health Outcomes. Retrieved March 21, 2025, from https://centralindiana.stateofaging.org/health-outcomes/
- Szylińska, A., Kotfis, K., Bott-Olejnik, M., Wańkowicz, P., & Rotter, I. (2022). Post-stroke outcomes of patients with chronic obstructive pulmonary disease. Brain Sciences, 12(1), 106.
- Motl, R. W., & McAuley, E. (2010). Physical activity, disability, and quality of life in older adults. Physical Medicine and Rehabilitation Clinics, 21(2), 299-308.
- Walsh, R. (2011). Lifestyle and mental health. American psychologist, 66(7), 579.
- Bridging the Gap: The Role of Education in Reducing Economic Inequality. (n.d.). Https://Yblc.Org/. Retrieved March 11, 2025, from https://yblc.org/bridging-the-gap/https://yblc.org/bridging-the-gap/
- https://www.savi.org/feature_report/equity-in-economic-opportunity-how-race-place-and-class-impact-economic-mobility-in-indianapolis/ – A SAVI Article
- Bevel, M. S., Tsai, M. H., Parham, A., Andrzejak, S. E., Jones, S., & Moore, J. X. (2023). Association of food deserts and food swamps with obesity-related cancer mortality in the US. JAMA oncology, 9(7), 909-916.
- Food Empowerment Project, Food Deserts—Food Empowerment Project. (n.d.). Retrieved March 6, 2025, from https://foodispower.org/access-health/food-deserts/
- Kendzerska, T., Zhu, D. T., Gershon, A. S., Edwards, J. D., Peixoto, C., Robillard, R., & Kendall, C. E. (2021). The effects of the health system response to the COVID-19 pandemic on chronic disease management: a narrative review. Risk management and healthcare policy, 575-584.
Next Up
 Understanding the “Why” Behind the “What” in the Spread of Disease
Dr. Patrick Lai is combining data from the Indiana Network for Patient Care and SAVI to understand which neighborhoods have higher rates of STDs and why.
 Summer 2017 Health Edition
The Summer 2017 issue of SAVI Online Magazine covers the influence of location on health. Learn about our latest health projects, from identifying health concerns in Fort Wayne to investigating where tobacco retailers are concentrated.
 Smoking During Pregnancy Declining in Marion County
Mothers who smoke during pregnancy not only put themselves at risk, but also the baby. Many health problems have been linked to mothers who smoke during pregnancy. These include infants […]
 A Model to Mitigate Hunger
By Sharon Kandris It’s clear that hunger and food insecurity are growing problems in Central Indiana. We’ve recently partnered with two Central Indiana organizations (Northside Mission Ministry of Second Presbyterian […]