SAVI Talks

SAVI Talks are data-informed conversations about the most pressing issues in our community.
Twice each year, SAVI Talks bring practitioners, researchers, and thought leaders together in a series of collaborative working sessions to discuss trends, share best practices, and brainstorm solutions related to the state’s most pressing areas of need.
WFYI Public Media has partnered with The Polis Center on SAVI Talks events since 2015.
MOST RECENT SAVI TALK
Understanding Urban, Suburban, and Rural Contexts for Ministries
December 5, 2024 9-11 a.m. (virtual)
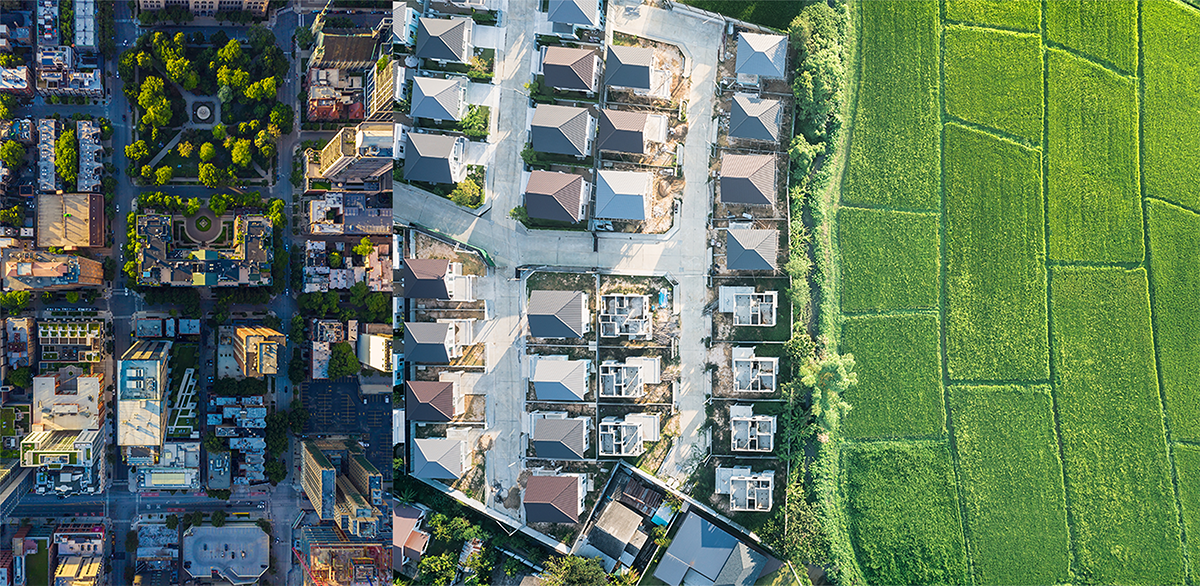
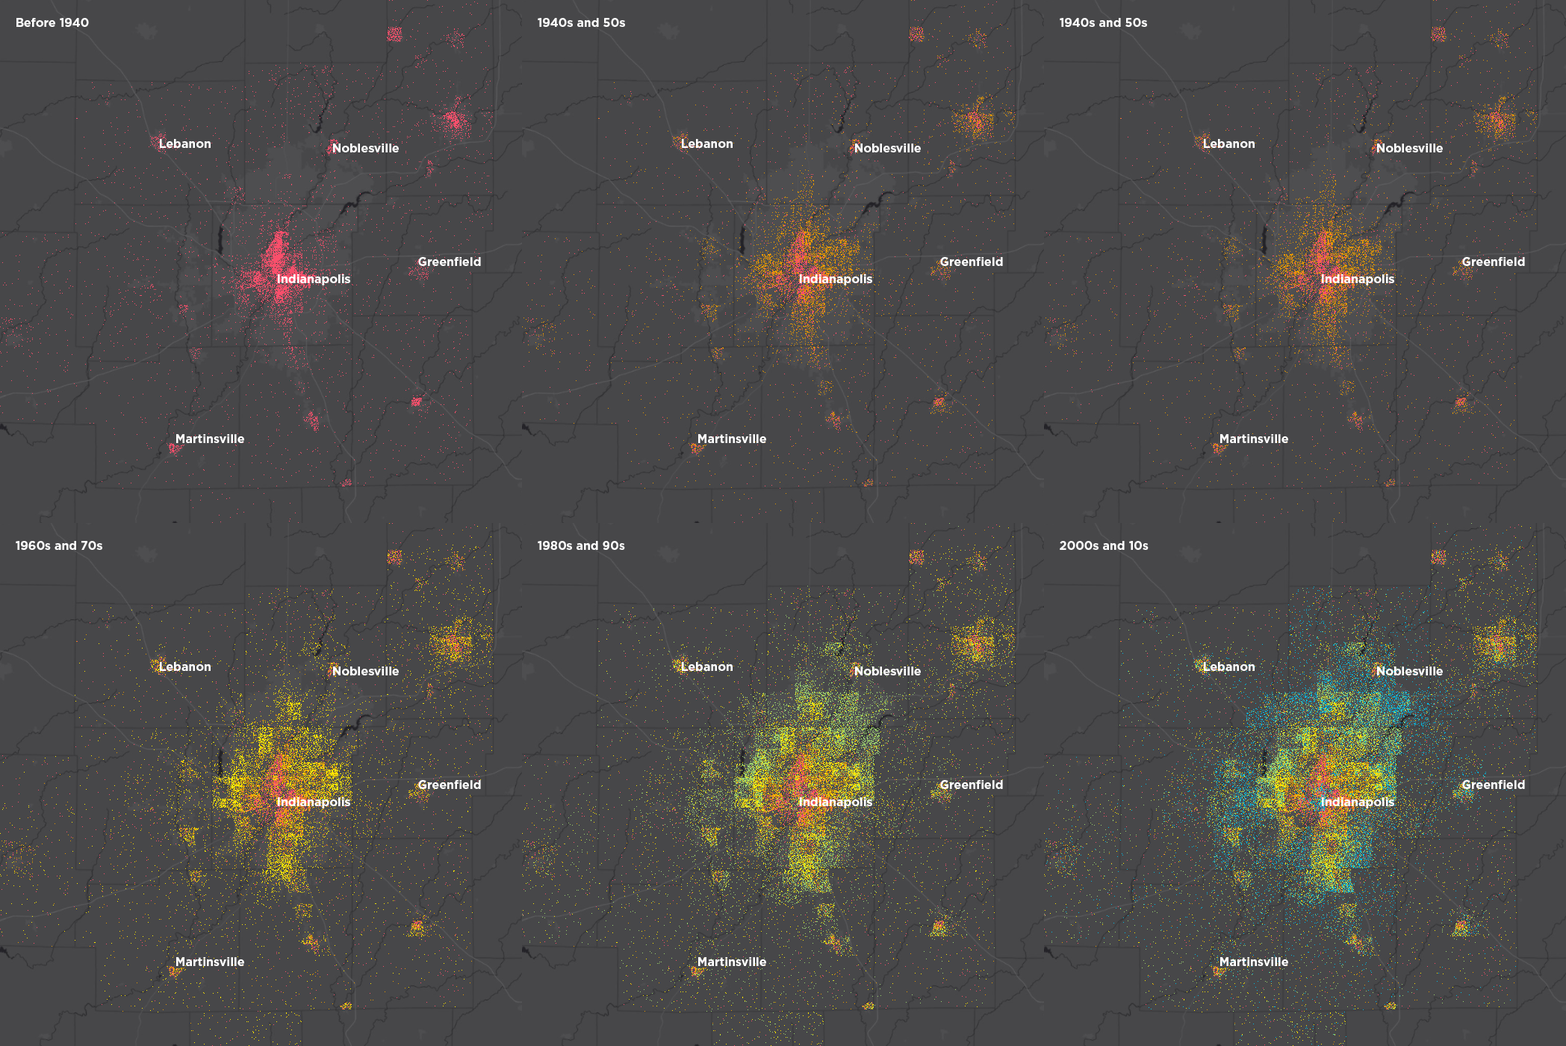
Understanding Urban, Suburban, and Rural Contexts for Ministries, shared a number of interesting findings. The recent election demonstrated just how different rural, urban, and suburban environments are when it comes to voting. And these are not tiny differences. They are more like 60/40, 70/30, or even 80/20. Most of the racial and ethnic diversity in Indiana is in cities. This has changed over the past several decades for Latinos. There are still very few Black people living in rural Indiana. How congregations think about issues like race, sexuality, gender identity, guns, climate change, animal rights and many other things are rooted in their social environment. With more and more Hoosiers living in suburban areas, it is important to consider the ways faith congregations are adjusting and the implications for the larger communities of which they are a part. Join us for this webinar that explores the intersections of religion, place, and changes in society. The demographic trends by community type have wide applicability in other contexts as well.
PREVIOUS SAVI TALKS
Indianapolis Racial Equity Report Card
June 20, 2024 9-11 a.m. (virtual)
The Indianapolis Racial Equity Report Card identifies racial disparities and inequities in several key areas affecting quality of life and our economy. This baseline report shines a light on areas for improvement and will allow us to track how we are doing as a community moving forward.
These important data can be used to shape programming, inform policy and planning, justify grants, and educate stakeholders working together to address the underlying drivers of these inequities and disparities.
Please join us on June 20 for the launch of the report card to learn how Indianapolis is doing on racial equity compared to its peers, and hear from panelists how this impacts our community.
Empowering Indiana Communities with Evictions & Foreclosure Data
December 23, 2023 9-11 a.m. (virtual)
On Dec. 7, The Polis Center showcased a new statewide tool it developed that will help users better understand trends and relationships between evictions and societal factors. The goal of the tool is to raise awareness of evictions in Indiana and provide a resource to empower communities to instill change. The dashboard features many resources for tenants, researchers, and stakeholders.
Greenways Assessment of Marion County
April 20, 2023 9-11 a.m. (virtual)
Greenspace is an important component of many cities, serving to improve quality of life. This presentation will demonstrate a new tool developed for SAVI, centered around greenspace in Marion County.
This tool will illustrate the areas which would benefit the most from targeted greenspace development.
We will discuss how we designed this tool, how to use it, and what we can learn from it moving forward to help improve the communities we live in.
Indianapolis Racial Equity Report Card
October 27, 2022
On October 27, the SAVI Talks event focused on the project, Indianapolis Racial Equity Report Card. This event was a bit different from others in that we wanted a community conversation about the outcomes that are important to measure as Indy holds itself accountable to creating a racially just and more equitable community. Racial disparities define daily life in Indianapolis, with racial segregation creating huge differences in life expectancy between neighboring communities.
Who’s in Marion County Jails? Exploring Length of Stay through an Equity Lens
June 16, 2022
We examine inmate and booking data obtained from the Marion County Sheriff’s Officem exploring length of stay and the presence of mental health and substance use among Marion County Jail inmates, drawing attention to the characteristics of those with longer lengths of stay or charges that might merit alternative responses in the community or reduced jail time. We also examine racial disproportionalities within the jail, as half of inmate bookings in recent years are from the Black community, in comparison to the racial composition of Marion County, which is only 30% Black.
Worlds Apart: An Update on Gaps in Life Expectancy in Central Indiana
August 26, 2021
IU Fairbanks School of Public Health and The Polis Center partner to analyze gaps in life expectancy across communities. We will see which communities gained or lost life expectancy over a 10-year span (prior to COVID-19), and we’ll compare life expectancy at different ages across the life course to see how patterns differ.
Equity in Aging
April 22, 2021
Older adults face inequities from the actions of individuals and organizations, and at institutional and systemic levels. These inequities are based on, but not limited to, differences in age, race, ethnicity, gender identity, and socioeconomic status and class.
Equity in Economic Opportunity
March 25, 2021
Building on research by Harvard’s Raj Chetty and his team, we are developing new insights and highlighting finding about opportunity in Indianapolis neighborhoods.
The income of the family you’re born into makes a big difference in how much you will earn as an adult. But race and neighborhood factors play a large role, too.
Health and Economic Impacts of Covid-19 on Neighborhoods
October 2020
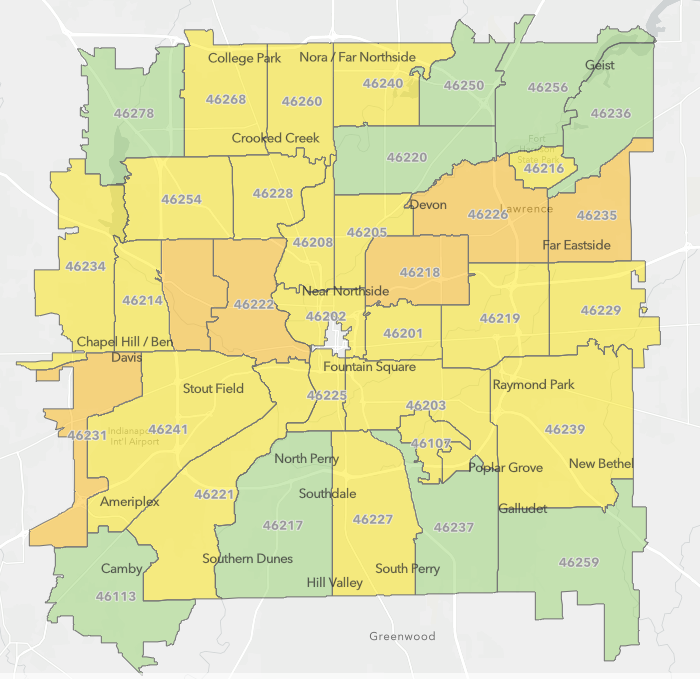
SAVI created a COVID-19 Impact Index. This describes the impact in a ZIP code and its underlying risk in terms of health and the economy. We used indicators like confirmed Covid-19 cases, unemployment claims, and rental assistance applications to measure the impact of the pandemic on neighborhoods. We used the presence of underlying health conditions and socioeconomic conditions to measure a neighborhood’s vulnerability.
The results show that the hardest hit ZIP codes were 46222 on the west side, 46218 near Martindale Brightwood, and 46226 on the northeast side. Some groups are more likely to live in a high-impact ZIP code, including people of color, people living in poverty, and people with a disability.
Getting Groceries: Food Access Across Groups, Neighborhoods, and Time
November 2019
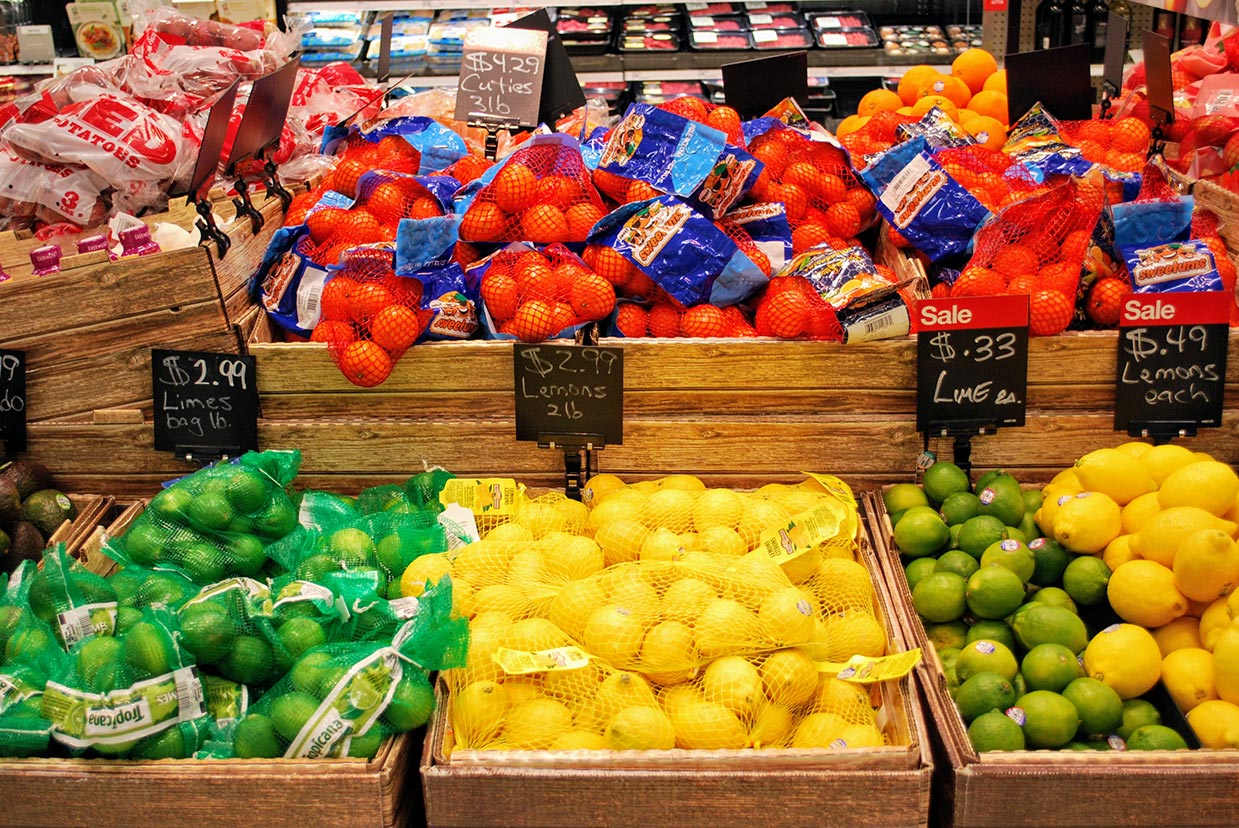
208,000 people live in food deserts in Indianapolis, an increase since 2016. This was driven somewhat by the closure of Marsh stores. However, there are more grocery stores now (200) than in 2016 (199). These stores tend to be located near each other, and so provide access to less area and fewer people. People without cars are heavily impacted. Three-in-ten households without a car live in transit food deserts, where grocery stores are not easily accessible by bus.
The Changing Landscape of Poverty
June 2019
The poverty rate in Central Indiana has risen from 9% in 1970 to 14% in 2017, but the rates vary widely by neighborhood. How is poverty changing at the local level? Who is most affected by these changes?
Historically, poverty has been highest in core urban neighborhoods where, in 1970, one in six residents lived in poverty. Now that number is one in three. Poverty has grown the fastest in middle-ring suburbs where the rate has quadrupled from 5% in 1970 to 20% in 2017. Meanwhile, some neighborhoods, such as those built since 2000, have had consistently low rates of poverty and have experienced very little change in those rates..
Where Schools are Changing
November 2018
Regionally, schools are becoming more racially diverse, have a growing share of low-income students, and have increasing graduation rates. Low-income student population is falling in central Indianapolis and growing in Marion County’s townships, pointing to a growing number of low-income families living in first-ring suburbs. Schools experiencing similar change tend to be grouped geographically, with rapidly changing schools in more urban areas, and those holding steady in racial and income change located in more suburban and rural areas.
Neighborhood Change Across the Indianapolis Region
June 2018
Neighborhoods are changing rapidly as changing demand for housing and quality of life drive a return to the city-center. The June 2018 SAVI Talk and Community Trends Report will focus on that change. How do we measure it? Where is it occuring? And most importantly, who is it affecting.
Who Rides the Bus: Marion County Transit Ridership
September 2017
This research combines information from the recent IndyGo survey with a variety of neighborhood socio-economic factors from the SAVI community information system to better understand how and why certain groups of riders used the service. The report provides general audiences with an informed geographic approach to transit to see how place plays into the equation.
Unequal Access: Tobacco
Retailer Density
June 2017
This research explores how health, economic, demographic factors relate to tobacco retail density. We find that tobacco retailers are concentrated in areas with higher poverty, higher proportions of people of color, and lower educational attainment. These areas also have higher maternal smoking rates and estimated adult smkoing rates.
The Affordable Housing Market and Why It Matters
November 2016
Indianapolis is routinely recognized as one of the more affordable regional housing markets in the nation. This relative affordability lies within the eye of the beholder as Indianapolis also fares relatively poorly in income inequality. To many low-and moderate-income households, the housing of their choice may be out of reach. The central theme of the report: affordable housing encompasses a broader range of economic issues than the price of a home.
IndyVitals: Citywide
Impact Dashboard
June 2016
Indianapolis is routinely recognized as one of the more affordable regional housing markets in the nation. This relative affordability lies within the eye of the beholder as Indianapolis also fares relatively poorly in income inequality. To many low-and moderate-income households, the housing of their choice may be out of reach. The central theme of the report: affordable housing encompasses a broader range of economic issues than the price of a home.
Trends in Crime: Does Perception Match Reality?
September 2015
Although we see and hear about the horrible crimes committed every day in both local and national news, crime rates across the United States have decreased dramatically over the past two decades. Overall, crime rates in Marion County are at the lowest level since 2007. However, this improvement is uneven. Violent crime rates have actually risen, and crime is four times higher in high-crime neighborhoods than in low-crime areas.
Worlds Apart: Gaps in
Life Expectancy in the
Indianapolis Metro Area
July 2015
Residents of a Hamilton County suburb have an average life expectancy that is 14 years higher than the life expectancy of residents closer to downtown Indianapolis – 83.7 years compared to just 69.4 years. Research conducted by the Fairbanks School of Public Health found that in the metro Indianapolis community with the lowest life expectancy in the survey area, a baby born today is likely to live only as long as a baby born in the United States more than 60 years ago.

